Unemployment Rate Differences between Black and White Americans


A recent Pew Research Center report in FacTank, analyst, Drew DeSilver, said that since 1954, the unemployment rate of Black Americans has consistently been twice that of White Americans. The report is based on data taken from the Labor Force Statistics, a part of the Current Population Survey (CPS), a monthly survey of 4,500 scientifically selected American households. The data are collected for the U. S. Bureau of Labor Statistics by the U.S. Census Bureau

 In 1954, the unemployment rate for Black Americans was 1.98 times that of White Americans while in 2013 the rate for Black Americans was exactly twice that of White Americans and in 1983, the rate for Black Americans was 2.32 times that of White Americans. Overall, the unemployment rate for Black Americans since 1954 is 2.2 times that of White Americans.


Read more:
http://pewrsr.ch/13FF0U0  
http://www.pewresearch.org/
http://www.pewresearch.org/fact-tank/
http://www.pewresearch.org/author/ddesilver/
http://www.bls.gov/cps/
http://www.bls.gov/
http://www.census.gov/

The Euro Zone Remains Mired in Recession

The euro zone remains mired in recession despite greatly improved financial conditions over the past nine months due to the European Central Bank’s efforts to save the currency.Output declined by 0.2% in the first three months of 2013 from its level late last year, the sixth consecutive quarter of a recession that started in late 2011. GDP rose by just 0.1% in Germany, the biggest economy in the euro zone and declined by 0.2% in France, the second biggest. Falls in southern Europe were much bigger, with GDP declining by 0.5% in Italy and Spain and 1.3% in Cyprus.

Forecasts from the European Commission in early May showed annual euro-zone GDP shrinking by 0.4% in 2013, following a contraction of 0.6% in 2012. The economic reverse will be much deeper on the periphery of the euro zone than in its core. Cyprus is the worst performer this year as its GDP shrinks by 8.7%. Conversely, Estonia’s GDP will rise by 3% in 2013. Within the 27-nation European Union (EU), Latvia’s GDP will increase by 3.8%, and is expected to join the euro zone next January.

The disparity between core and periphery is particularly stark in labor markets. Unemployment in Germany was just 5.4% of the workforce in March 2013, whereas in Greece and Spain it was around 27%. The gap is even bigger for young people. In Germany the youth jobless rate was 7.6% in March whereas it was 56% in Spain and reached 64% in Greece in February. These figures overstate the blight of youth unemployment because many young people are in full-time education and do not count as part of the labor force. 

Even so there has been more rebalancing in the periphery than is sometimes appreciated. Current-account deficits which had ballooned in the first decade of the euro have narrowed. Portugal’s deficit has shrunk from 12.6% of GDP in 2008 to 1.5% in 2012; over the same period Greece’s has fallen from 15% to 3%. Primary budget balances are also on the mend. Greece’s is expected to reach zero in 2013 from its deficit of 10.5% of GDP in 2009. The highest primary deficit in the EU this year will be run by Britain, 3.9% of GDP.


Despite these improvements, government debt levels are worryingly high in the periphery. Despite a bond buyback late last year and the write-down of over half of privately held debt in March 2012, Greek debt will reach 175% of GDP by the end of this year. Although Greece is being helped by interest deferral and maturity extension along with very low interest rates, it needs a further restructuring, this time of official debt. Italy’s debt burden continues to rise, to 131% of GDP this year, and debt in Ireland and Portugal is forecast to reach 123%.

http://www.economist.com/blogs/graphicdetail/2013/04/european-economy-guide

Seasonal Spike in Jobless Claims

Americans seeking unemployment aid rose sharply in the past week.  According to the Associated Press,  38,000 Americans filed for unemployment, making the seasonally adjusted total 368,000.  In addition, the number of applications fell by 45,000, reaching a five-year low.  Reasons for the increased amount of unemployment is the termination of seasonal retail work.  As such, it hasn't caused much alarm among economists, who are projecting that January's job report will show that 155,000 more jobs were added and that the employment rate will remain constant at 7.8%.

The article suggests that steady hiring will counter the contraction of the national economy that has been caused by decreased military spending and fewer exports.  Positive signals for the economy include increases in consumer spending (which accounts for 70% of activity), business investments in equipment and software, and rising housing prices.

Can Obama's second term outperform his first?


On President Obama’s inauguration day for his second term, the Economist explores the economic performance of two-term presidents since the start of the 20th century.  A range of sources measured performance according to industrial production, federal debt, GDP, stock market, household income, unemployment rate, and real house prices.  The overall score of each president’s second term decreases by an average of 4.2 percentage points from their first term score.

Don’t write off Obama’s second term yet, though.  Franklin Roosevelt’s highly successful New Deal policies in his first term led to a substantially lower relative second term, and three of the eleven two-term presidents (including most recent Democratic president Bill Clinton) had higher economic performances in their second terms.

California's Recovering Economy


Adam Nagourney, writing for The New York Times, examined California's recovering economy.  Compared to the rest of the nation, the Golden State experienced one of the longest and harshest downturns, spurred on by widespread foreclosures and a ballooning unemployment rate that surged to over 12.4% in mid-2010.  But by October, unemployment had dropped to 10.1% - high for most states, but a marked improvement for California.  In fact, the month-to-month drop from August to September (10.6% to 10.2%) was the state's largest decrease in the 36 years since it began tabulating unemployment statistics.  The housing market is recovering as well.  Home sales are up 25% from a year ago, and houses are staying on the market for a shorter period of time and selling for higher prices. The California Legislative Analyst's Office projects the state to post a $1.9 billion deficit next year, and perhaps even a $1 billion surplus.  California's deficit was at one point over $25 billion – bigger than many states' budgets.  With that said, a significant geographical divide characterizes the recovery.  Coastal areas are posting much lower unemployment rates and possess healthier housing markets than the inland areas.  Additionally, by some measuresCalifornia still has the worst poverty rate.  The state has rebounded significantly, but still has considerable work left to be done.  

Deteriorating Jobs Outlook Across the EU

Across the European Union, the jobs outlook is steadily worsening. According to a Gallup report, over 90% of citizens in Greece (98%), Italy (95%), Spain (94%), and Ireland (92%) think that it is a "bad time" to find a job in their area. The majority of citizens in 25 of the 27 countries in the European Union report a pessimistic job outlook. This finding coincides with Eurostat's findings that the EU is currently experiencing some of the highest unemployment levels ever recorded in Europe. Countries with the most staggering unemployment rates include Spain (23.8%), Greece (25.1%), Latvia (15.9%), Portugal (15.7%), Ireland (15.1%), and Slovakia (13.9%). The jobs outlook across the EU has worsened since 2011, and in recent months (August 2012-September 2012), unemployment levels have continued to decrease. Since 2011, the jobs outlook has gotten significantly worse in Finland, the Netherlands, Luxembourg, Belgium, Sweden, France, Austria, Denmark, Hungary, the Czech Republic, and the United Kingdom.


It is important to note that since 2011, there have been improvements in the jobs outlook in Latvia and Estonia. Additionally, the majority of Germans (46% compared to 43%) and approximately 1/3 of Swedes (32%) and Austrians (35%) feel that it is a "good time" to find a job in their country. Comparatively, 25% of Americans feel it is a "good time" to find jobs in their area. Also, the estimated percentage of the population that is employed by a full time employer has remained stable in most EU countries in 2012.


However, the countries that have severely pessimistic jobs outlooks also have the lowest percentage of full-time employees. Less than 1 in 3 adults are employed full time in Greece, Romania, Italy, Belgium, Spain, and Ireland. Because of the decreasing percentage of the population that is employed full time, the tax-base is shrinking. Therefore, countries across the EU are not just facing high unemployment levels and dismal job outlooks; they are facing long-term economic instability.

More Chinese Women in Labor Force than Indian Women


Recent findings released by Gallupindicate that China’s female labor force participation rate (70%) is significantly greater than India’s (25%).  Not only are Indian women less likely to be present in their country’s labor force than Chinese women, women in India’s labor force are three times more likely to be unemployed (with an unemployment rate of 15%) than their Chinese counterparts (with an unemployment rate of 5%). Furthermore, women in China are nearly twice as likely to be employed full-time than women in India (21% verses 11%).  In addition, 53% of highly educated Chinese women reportedly hold a “good job” whereas only 17% of Indian women who received tertiary education maintain a “good job”.  There are also significant discrepancies in the literacy rates of Chinese females (91%) and the Indian females (50%).   In sum, Chinese women are much more likely to receive even a basic education than Indian women, and, among Chinese and Indian women who receive higher education, Chinese women are much more likely to find full-time employment. While the Chinese economy (with a 9% growth rate) is currently out-performing India’s economy, (with a 6.8% growth rate) China’s growth is expected to stall due to low fertility rates and an aging population. On the other hand, India’s population of working-aged citizens is expected to steadily increase until about 2030 and this can lead to major economic growth if India encourages greater female labor force participation.  

Underemployment Continues to Fall, But Is Still Double Pre-Recession Level


With the jobs numbers released this past Friday, highlighting Gallup's underemployment statistics provides another look into the employment situation in America.  Gallup defines underemployed workers as those who work part-time but desire a full-time job, along with Americans who are simply unemployed. This figure is an important supplement to the BLS' jobs numbers, as it illustrates the lingering frustration within the American economy that is not quite as apparent in Friday's optimistic report.  While underemployment has tailed off in recent months, it's still well above levels seen before the recession.  16.5% of workers are underemployed, down from over 20% in 2010 and 18.1% this time one year ago.  Before the housing bubble burst and drove the economy into a downward spiral unseen since the Great Depression, underemployment had sunk to below 8%, but as companies laid off workers and scaled back domestic operations, Americans were left struggling to find full-time employment, prompting a spike in unemployment and underemployment.  Still, though, the 16.5% underemployment rate is the lowest since the start of the recession, and it continues to steadily drop as the year progresses.  

The rate of unemployment in the U.S. will fall to 6.2% by 2014

On March 1, 2012 we predicted (in a Seeking Alpha post) the rate of unemployment in the U.S. to fall down to 7.8% by 2013. The BLS announced 7.8% for September 2012. Here we present our basic model and predict the evolution of unemployment in 2013.

In 2006, we developed three individual empirical relationships between the rate of unemployment, u(t), price inflation, p(t), and the change rate of labour force, LF(t), in the United States. We also built a general relationship balancing all three variables simultaneously. Since measurement (including definition) errors in all three variables are independent it may so happen that they cancel each other (destructive interference) and the general relationship might have better statistical properties than the individual ones. For the USA, the best fit model for annual estimates was a follows:

u(t) = p(t-2.5) + 2.5dLF(t-5)/dtLF(t-5) + 0.0585 (1)

where inflation (CPI) leads unemployment by 2.5 years (30 months) and the change in labor force leads by 5 years (60 months). We have already postedon the performance of this model several times.

For the model in this post, we use monthly estimates of the headline CPI, u, and labor force, all reported by the US Bureau of Labor Statistics. The time lags are the same as in (1) but coefficients are different since we use month to month-a-year-ago rates of growth. We have also allowed for changing inflation coefficient. The best fit models for the period after 1978 are as follows:

u(t) = 0.63p(t-2.5) + 2.0dLF(t-5)/dtLF(t-5) + 0.07; between 1978 and 2003

u(t) = 0.90p(t-2.5) + 4.0dLF(t-5)/dtLF(t-5) + 0.30; after 2003

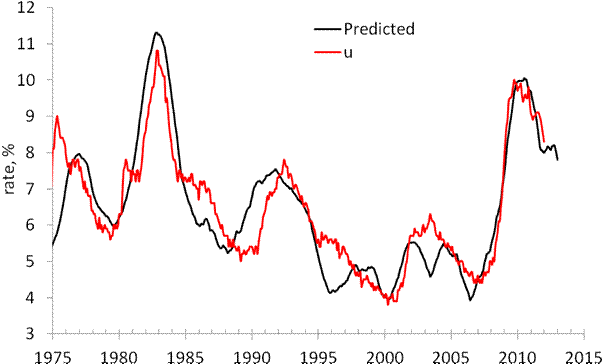
There is a structural break in 2003 which is needed to fit the predictions and observations in Figure 1. Due to strong fluctuations in monthly estimates of labor force and CPI we smoothed the predicted curve with MA(24).

The structural break in 2003 may be associated with the change of sensitivity of the rate of unemployment to the change of inflation and labor force. Alternatively, definitions of all three (or two) variables were revised around 2003, which is the year when new population controls were introduced by the BLS. The Census Bureau also reports major revisions to the Current Population Survey, where the estimates of labor force and unemployment are taken from.

On March 1, 2012 the monthly model predicted a drop from 8.3% in February to 7.8% by the end of 2012. Figure 1 depicts the original prediction (upper panel) and the observed fall in the rate of unemployment (lower panel). Figure 2 shows that the observed and predicted time series are well  correlated (Rsq.=0.81). This is a good statistical support to the model.

Figure 3 depicts the predicted rate of unemployment for the next 12 months. The model shows that the rate will fall to 6.2% by September 2013. For 105 observations since 2003, the modelling error is 0.4% with the precision of unemployment rate measurement of 0.2% (Census Bureau estimates in Technical Paper 66).
 
Hence, one may expect 6.2% [±0.4%].
 
 
Figure 1. Observed and predicted rate of unemployment in the USA as obtained in March and October 2012.


Figure 2.  Observed vs. predicted rate of unemployment between 1967 and 2012. The coefficient of determination   Rsq=0.81.


Figures 3. The predicted rate of unemployment. We expect the rate to fall down to 6.2% in September 2013.

How many democrats are needed to bias unemployment figures?


I do not consider any possibility that the Current Population Survey conducted by the U.S. Census Bureau for September 2012 is biased by CB or by the BLS, This is not the case. There is another hypothetical way to bias the data. There are around 70000 households surveyed by the CB. These households include approximately 200000 persons (mean household is 2.5 people). All these people (excluding several percent not responding ones) answer a few questions associated with their current status: employed, unemployed or not in the labor force. There current level of civilian labor force is approximately 155,000,00 with 12,000,000 unemployed. These figures are calculated by a projection of 200,000 to 310,000,000 using population controls. In essence, one person represents 1550 people.

How many people are needed to increase the rate of unemployment by 0.1%? The rate of unemployment is calculated as the ratio of the number of unemployed and labor force.   So, 0.1% of unemployment rate with the level of labor force of 155,000,000 corresponds to 155000. Since one person in the CPS represents 1550 people, one needs only 100 people to increase the rate of unemployment by 0.1%. To decrease the rate by 0.3% , only 300 (democrats -Spartans?) are needed.

I do not say that the result for September 2012  is biased. I say that the Current Population Survey procedure is wide-open for manipulations.

7.8% unemployment was predicted in April 2012


In 2006, we developed three individual empirical relationships between the rate of unemployment, u(t), price inflation, p(t), and the change rate of labour force, LF(t), in the United States. We also built a general relationship balancing all three variables simultaneously. Since measurement (including definition) errors in all three variables are independent it may so happen that they cancel each other (destructive interference) and the general relationship might have better statistical properties than the individual ones. For the USA, the best fit model for annual estimates is a follows:

u(t) = p(t-2) + 2.5dLF(t-5)/dtLF(t-5) + 0.0585 (1)

where inflation (CPI) leads unemployment by 2 years and the change in labor force by 5 years. We have already postedon the performance of this model several times.

Here a model with monthly estimates of CPI, u, and labor force is presented. The time lags are the same as in (1) but coefficients are different since we use month to month a year ago rates of growth. We have also allowed for changing inflation coefficient. The best fit models for the period after 1978 are as follows:

u(t) = 0.63p(t-2) + 2.0dLF(t-5)/dtLF(t-5) + 0.07; between 1978 and 2003

u(t) = 0.90p(t-2) + 4.0dLF(t-5)/dtLF(t-5) + 0.30; after 2003

There is a structural break in 2003 which is needed to fit the predictions and observations in Figure 1. Due to strong fluctuations in monthly estimates of labor force and CPI we smoothed the predicted curve with MA(24). The rate of unemployment became more sensitive to the change of inflation and labor force. Alternatively, definitions of all three (or two) variables were revised around 2003, which is the year when new population controls were introduced by the BLS.

All in all, the monthly model predicts the observed rate of unemployment which has recently dropped to 8.3%. We expect the rate to fall further to the level of 7.8% by the end of 2012.


Figure 1. Observed and predicted rate of unemployment in the USA.

Household Income Left Behind In Recovery


Rakesh Kochar, writing for the Pew Research Center, examined household income during the recent recession and recovery.  From 2007 to 2009, the median household income fell 4.2%, and while the economy began to turn around and businesses started to rebuild, incomes continued to drop.  From 2009 to 2011, as the U.S. embarked on a sluggish recovery, the median income failed to improve.  In fact, the median household income fell almost as much (4.1%) during the recovery years as during the recession.  After a 5.7% decrease in household income due to the 1973 recession, incomes salvaged a 2.3% increase in the following 2 year recovery period.  The 1980 to 1982 recession drove incomes down 5.0%, but in the subsequent two-year recovery, incomes rebounded with a 2.4% improvement.  This prolonged period of income losses reflects a greater trend from the past decade.  The highest median household income was $54,932 in 1999, and since then, that level has only been approached in 2007, when incomes were $54,489.  

Income, Poverty and Health Insurance Coverage


On Wednesday, the Census released its yearly report on "Income, Poverty, and Health Insurance Coverage in the United States: 2011."  Median household income fell for the fourth straight year to $50,054.  Men still earn more than women; the median income for men was over $11,000 more than for women.  Looking at various ethnicities, Asians possess the highest median household income at $65,129, followed by Whites with $55,412, Hispanics at $38,624, then and Blacks with $32,229. 

The recession's impacts on income were wide-ranging, and as a result poverty increased drastically.  While the poverty rate fell, it did so only slightly, dropping from 15.1% in 2010 to 15.0% in 2011.  Since 1965, the poverty rate jumped above 15.0% for just five years – 1982, 1983, 1993, 2010 and 2011. 

Lastly, health insurance coverage improved slightly from 2010; however, over 48 million continue to forego coverage.  15.7% of the population lacks health insurance.  This lackluster rate finds its roots in companies' inability to provide employer-based coverage, and in Americans’ inability to simply find a job.  With an unemployment rate that has doubled since the start of the recession and businesses around the country struggling to remain profitable while still providing health benefits, 11 million less Americans received health insurance through their jobs in 2011 than in 2000.  On the other hand, the number of people relying on government health insurance programs, such as Medicare and Medicaid, has shot upwards more than 31 million in that same timeframe.  

Housing Prices Still Low, But Sales Fail to Pick Up


While housing prices have stabilized, the quantity of one-family homes sold throughout the U.S. continues to fall to levels unseen in decades.  Though prices continue to rebound, the median cost of a single-family home is still at its lowest in 8 years ($227,000).  The drop in price, however, has not motivated Americans to buy homes.  The Department of Housing and Urban Development’s estimates the sales of new single-family houses at a seasonally adjusted annual rate of 372,000.  Though up 25% from July of last year, housing sales haven’t been this low since before the Census began tracking the figure in the 1963.  Sales fell 76% from 2006 to 2011, and have yet to show significant periods of recovery.  With a record low number of houses starting construction this year, and an unemployment rate still above 8%, the recession’s lingering consequences still hinder a sales rebound.  With that said, prices have fallen three straight months; will relatively low prices incite a rebound in the housing market? 

Unemployment Falls in 305 of 372 Metropolitan Areas


Unemployment in America is slowly improving.  The Bureau of Labor Statistics monthly report on metropolitan area employment and unemployment shows that from July of 2011 to last month, unemployment rates decreased in 305 of 372 metropolitan areas.  The number of areas posting over 10.0 percent unemployment nearly halved from 112 to 67.  Overall, the unemployment rate was 8.3% in July, illustrating a comeback – albeit a sluggish comeback – from when unemployment topped off at nearly 10.0% nationally.  Still though, just 18 of the 372 metropolitan areas registered unemployment rates of less than 5.0%.  To put that figure in perspective, before the recession, the national unemployment rate dipped below 5.0% for over a year.

Obesity in America


Gallup’s assessment of obesity in America illustrates some interesting trends.  Blacks are more likely to be obese than any other race.  20.8% of Blacks received the distinction of falling into the obese class I.  8.8% were in obese class II and 6.0% in obese class III. The latter two categories are recognized as very obese.  Asians were the least likely to be obese with only 7.6% falling into obese class I, 2.1% in obese class II, and 1.0% in obese class III.  Overall, men are more likely than women to be obese, but a slightly higher percentage of women are categorized in obese class III (4.0% versus 2.9%).  Additionally, unemployed Americans are more likely to be obese than those who possess a job.  

Finally, both income and education are related to obesity levels.  As Americans obtain higher levels of education (the study tracks those with high school or less up to postgraduate degrees), they are less likely to be obese.  5.2% of those who earn less than $36,000 a year have BMIs high enough to be categorized in obese class III, compared to just 1.8% of Americans who earn greater than $90,000 a year.  

To be considered obese, one must have a body mass index (BMI) of over 30.  For a person who is 5 feet 9 inches, his/her weight would need to rise above 203 pounds to be classified as obese.  To fall under obese class III, that same person would need to weigh over 271 pounds.

How Does This Economic Downturn Compare to Previous Recessions?


Bill McBride, writer for the blog Calculated Risk, compiled employment statistics from every post WWII recession and displayed them on a graph.  The chart illustrates the severity of the current recession and the enduring gap in employment.  It took 46 months for employment to return to levels seen in the month prior to the 2001 recession – the longest period of time following a recession.  Employment recovered in 31 months during the 1990 recession, and after a more than 5% drop in employment during the 1948 recession, employment losses were cut after just 22 months. The U.S. has experienced a drop in almost 6.5% employment during the current recession, and it’s been over 53 months since the beginning of the recession.  Employment has risen considerably since it bottomed out in the 25-month mark, and it is currently about 3.5% below the level prior to the downturn.  

Brookings Institution Finds Economic Recovery in Metro Areas to be Sluggish and Uneven


The Brookings Institution released its July Metro Monitor, in which the organization inspects key economic indicators from each of America’s 100 largest metropolitan areas in order to assess the national recovery.  The findings point towards a sluggish recovery.  Since the fourth quarter of the previous year, employment among the U.S.’s most populated regions rose 0.5%, unemployment fell 0.3%, GDP grew 0.6%, and housing prices decreased 2.1%.  Brookings points out diminishing GDP growth and meager job numbers as the most troubling indicators. 
Texas metro areas, due to a booming natural gas sector, experienced a more mild recession, and have thus pulled out of the downturn better than most regions.  High-tech metro areas such as Boston, Raleigh, San Jose, and Seattle have benefited from stabilization in housing prices, while on the other hand the majority of metro areas in the west have performed poorly.

"Disappointing" April Jobs Report

A recent Wall Street Journal article discusses what it refers to as a "disappointing jobs report" for April.  While the unemployment rate decreased to 8.1%, this drop can largely be attributed to the 342,000 people who left the labor force over the same time period.  The interactive graphic from the article, which includes three graphs, highlights several unemployment trends since the recession began in 2008.  In one graph, the percentage change in payroll employment from 2008 to 2012 is compared to four other periods of recession.  As the graph shows, all jobs had been recovered by year five of the previous recessions but have still not been recovered since the recession beginning in 2008.  Another graph shows the percentage change in payroll employment since 2008.  As this graph indicates, construction has made little improvement at -25.8% while the education and health sector have improved by 9.1% since 2008.  Lastly, the third graph shows the percent change in payroll employment since 2008 by gender.  According to the graph, men were hit worse initially by the recession but have since made a more rapid recovery.  Currently, however, women are only 2.6% below pre-recession employment while men remain 4.6% below.


Low Population Mobility in European Union

A recent Economist article discusses the low cross-border population mobility within the European Union despite large variations in the unemployment rate across European nations.  This variation in unemployment rate can be seen in the first chart from the article, which shows Spain at approximately 23% unemployment as of March 2012 and Austria at less than 5%.  However, as the second graph from the article shows, few Europeans migrate within their countries and even fewer across countries in the European Union relative to the US, Canada and Australia.  The article suggests that this low mobility could be a result of language barriers, higher transaction fees and taxes for home-buyers and disincentives to move from large unemployment benefits, among other things.


Blog Archive