The Rise of Single Fathers

According to a recent report from the Pew Research Center based on the analysis of Decennial Census and American Community Survey data, the number of single father households has increased about ninefold since 1960, from less than 300,000 to more than 2.6 million in 2011.

In comparison, the number of single mother households increased more than fourfold during that time period, up to 8.6 million in 2011, from 1.9 million in 1960. As a result, men make up a growing share of single parent householders. In 1960, about 14% of single parent households were headed by fathers, today almost one-quarter (24%) are.


There are some notable differences between single mothers and single fathers. Single fathers are more likely than single mothers to be living with a cohabiting partner (41% versus 16%). Single fathers, on average, have higher incomes than single mothers and are far less likely to be living at or below the poverty line—24% versus 43%. Single fathers are also somewhat less educated than single mothers, older and more likely to be white. Compared with fathers heading households with two married parents, single dads are younger, less educated, less financially well-off and less likely to be white.

Share of Young Americans With Debt at Lowest Level Since 1983

According to Pew Research Center, although young adults took a hit in the recession, many actually managed to decrease their debt from 2007 to 2010. In 2007, among those under the age of 35, their debt totaled $21,912. But in 2010 the median debt level of young adults fell to $15,473 which is a 29% decline in just 3 years. It was estimated that older adults owed more than younger adults and unfortunately, their decline in debt was modest compared to young adults. Older adults were $32,543 in debt as of 2007 but they did manage to pay off some of their debt. This brought their median total debt level to $30,070 in 2010 which is only a 8% decline in debt.

Today's young adults also did a better job of paying off their debt during the recession than young adults in other time periods. The Pew Research Center estimates that in 2010 78% of households headed by a young adult held any debt. Although this figure may seem high, this actually marks the lowest level of young debt holders since 1983 when this data first started being collected by the government.

Although this news is certainly welcome to those who worry about high debt ratios among young Americans, it is important to examine why they have less debt. For one, part of this decline is due simply to the fact that fewer young Americans own homes or carry credit card balances. For instance, in 2007 it was estimated that 48% of young Americans had credit card debt compared to 39% of young adults in 2010. Moreover, although the total median debt level may have been lower in 2010, the proportion of households carrying student debt rose dramatically. In 2001, only 26% of younger households had student loan debt compared to 40% in 2010, marking a 14% increase in less than a decade.

Violent Child Abuse On the Decline


A special report from the U.S. Department of Justice’s Bureau of Justice Statistics finds that during 2010 roughly 2.8 million “children age 17 or younger… lived in a household in which at least one member age 12 or older experienced one or more nonfatal violent victimizations during the year.”  The data does not specify whether the child was present during the abuse or whether he was the victim of the attack, but it does provide insight into how diminished, yet still widespread, the issue violent crime against children is.  In 2010, 3.9% of children fell into the category of having lived in a household where violent child abuse took place, but this percentage has fallen over 68% since 1993, when approximately 8.7 million children, or 12.6%, lived in a household that experienced violent victimization.  Violent crimes occurred in low-income households (less than $15,000 a year) and in urban areas.  Additionally, households headed by one parent or a nonmarried adult were more prone to experiencing violent child victimization.

Household Income Left Behind In Recovery


Rakesh Kochar, writing for the Pew Research Center, examined household income during the recent recession and recovery.  From 2007 to 2009, the median household income fell 4.2%, and while the economy began to turn around and businesses started to rebuild, incomes continued to drop.  From 2009 to 2011, as the U.S. embarked on a sluggish recovery, the median income failed to improve.  In fact, the median household income fell almost as much (4.1%) during the recovery years as during the recession.  After a 5.7% decrease in household income due to the 1973 recession, incomes salvaged a 2.3% increase in the following 2 year recovery period.  The 1980 to 1982 recession drove incomes down 5.0%, but in the subsequent two-year recovery, incomes rebounded with a 2.4% improvement.  This prolonged period of income losses reflects a greater trend from the past decade.  The highest median household income was $54,932 in 1999, and since then, that level has only been approached in 2007, when incomes were $54,489.  

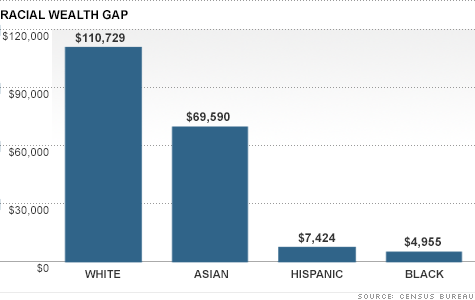
White Americans Possess 22 Times More Wealth Than Black Americans


Tami Luhby, writing for CNN, highlighted the widening wealth gap between races.  In 2010, the median household net worth for whites was $110,729, whereas the median Hispanic and black household possessed a net worth of $7,424 and $4,955 respectively.  The median Asian household net worth was $69,590.  However, all three minorities were hit hard by the economic downturn, and from 2005 to 2010 the three minority groups saw their median household income decrease by about 60%.  On the other hand, the median white household experienced a drop in net worth of only 23%.  Today, white Americans possess 22 times more wealth than blacks, and that disparity has almost doubled since the recession.

Blog Archive