Europe Day 3 & 4 in Germany

 Koln Cathedral

We were in Thalys train early morning on the third day from Brussels to Koln (Cologne), Germany. The journey took 1 hour 45mins and we had breakfast which is served in the first class carriage. Once we reached Koln station, we deposited our luggage in automated storage machine (costs €5 for 24 hrs) so that we could look out for something to do before catching up a plane to Hamburg at 4pm.

Looking out from the train station there was a magnificent cathedral - the most well-known architectural monument in Germany mounting to 157metres high. We went around it and saw a double-decker tour bus just besides it and decided to get a ride around the city. The tour took one & half hours and we enjoyed it very much getting to know the place.

By the time we returned back to Koln station, we were terribly hungry as it passed 3pm and at the same time my right leg was terribly throbbing. I was struggling and limping to walk from the bus stop to the train station while going round to look for lunch. We bought fish & chips for lunch but before we could even eat half of it, we realised that we may be out of time to get to the airport. Forgetting about my painful leg, we both running to get the luggages, buying train tickets to the airport & drag the bags up the escalator to the train platform. We both were very panic once we reached the platform because so many trains passing the platform with different destinations and there was no nearby information counter. At the end, we decided to take on the one with a plane symbol flashed in the dashboard. Once we were in the train and after passing several stations, I somehow felt uneasy because I wasn't sure that we were on the right train. I decided to approach some other passengers for help and the girl I spoke to confirmed that we were heading to the wrong airport (Düsseldorf instead of Cologne Bonn). My blood drained down and we knew that we definitely will miss the flight....! We stopped at the next station and get a taxi to drive us to the Koln Bonn airport. The worst news was not just we missed the flight, we gotta buy a new ticket that costed us 4 times more expensive. After negotiation, I manage to get some deduction but still costed me 3 times of the original price that we paid. We had no choice but to proceed and lucky enough to catch a flight scheduled 2 hours later. I was just looking forward and tried not to think so much about the unfortunate event.....

 Mölln view from the hill - this same view was published in Mölln 2011 calendar.

We finally reached Hamburg and my good friend Helge waited for us patiently despite having to wait much longer than anticipated. From Hamburg airport we drove to his village in Molln, about an hour drive. It was such a peaceful village and nice views of historic buildings. We were most welcome by Helge's wife Tina and the night was a good catch up with Helge after he left Miri less than a year ago.
 The famous statue of Molln trickster, Till Eulenspiegel.

The next morning (4th day in Europe), we spent time going round in Molln......
 Beautiful lake in Mölln

 Botanical Garden in Hamburg

After going round in Molln in the morning, Helge drove us to Hamburg for tour before sending us off to bus station. We had city tour by foot, lunch in one of the prestige shopping store in Hamburg (forgot to ask the name), drove around the city, visited Hamburg botanical garden, Hamburg harbour and finally dinner at Hamburg port at 9pm.
 Hamburg city view with Cik Liz in the scene

 My lunch (Helge's treat): Fried fillet, a piece of rye bread, saute mushroom, asparagus (below) and carrot juice (kuat nya makan.....hehehe)

Helge also gave us a treat for dinner and on Helge's recommendation, I tried marinated fish served with sour cream - which is actually uncooked Herrings. It was nice and no fishy smell at all. This dish is popular in Germany and Netherland.

So our trip to Germany ended here and we were on a bus to Amsterdam, departed at 10.30pm. Cannot thank Helge & Tina enough for the marvelous hospitality during our visit and hope we will meet again one day. Watch out for my next update in Amsterdam.

Why the level of unemployment does not matter for real economic growth II

In the previous post we demonstrated that the level of unemployment could hardly influence real economic growth because the portion of people out of labor force changes in a much wider range (by  a factor of 5) and still does not affect the real growth. Here we present a quantitative model explaining the long-term change in the labor force participation rate, LFP, which, obviously, defines the portion of people not in labor force. In this blog, we presented similar models for Canada and Italy but without appropriate math.

We first try to model dLFP/LFP as a nonlinear function of real GDP per capita, G, and tested a simple relationship:


dLFP(t)/LFP(t) =  D1[dG(t-T)/G(t-T) - A2/G(t-T)] +D2                                       (1)

where D1 and D2 are empirical constants, and A2 is also an empirical. The time interval is dt=1 year, and thus, omitted in the equation. The intuition behind this model is that it is real economic that drives the change in LFP. The evolution of LFP depends on the difference between the observed rate of growth and the potential rate of growth defined by a reciprocal function of G, A2/G.  

Figure 1 depicts the measured LFP and that predicted from real GDP per capita using equations (2) and (3). Both variables are borrowed from the Total Economy Database provided by the Conference Board. All in all, the model describes the evolution of LFP in the US since 1964 with an extremely high accuracy. In the mainstream economics, there is no other model of LFP predicting its evolution with a compatible accuracy. Moreover, the predicted curve leads by 2 years (T=2) that allows forecasting at a 2 year horizon. (See our post in January 2011 on the short term LFP prediction.)  


Al in all, the rate of participation in  labor force depends only on the evolution of real GDP per capita two years ago. Therefore, the level and rate of unemployment, as a part of labor force, plays no role in real economic growth. At least empirical facts say so.

Figure 1. Measured and predicted LFP in the US, where A2= $360 (1990 US dollars) is empirical constant. T=2 years.

Europe Day 2 in Brussels

 Me & Cik Liz woke up early in the morning on the second day to catch a train to Brussels and had our breakfast (croissant and tea) in the Paris hotel before we left. We had another round of breakfast in the train from Thalys first class service. I had mashed apple & yam sprinkled with muesli, a cup of yoghurt, layered cheese & pine nut sandwich and a cup of tea - all were really good. The trip took 1 hr 22min from Paris to Brussels and we enjoyed the country view along the journey.

I brought quite a big luggage because we had no time to do laundry as we scheduled ourselves to hop to a different country everyday. It was indeed a very ambitious plan and doing something out of my own comfort as I've been spoiled so much by my husband when he is around but traveling without him means I got to do everything by myself. Carrying the luggage up and down trains and station stair cases really took away my breath. So we decided to take a taxi this time from Gare du Nord train station to the hotel.
 We stayed in Bloom Hotel Brussels which I rate as 5* - spacious & beautiful lobby nicely scented with their own created air fragrant, comfortable bed and the special thing about this hotel is you can choose your room deco theme and we chose floral for ours. This hotel is only 5min from the next metro station Botanique.
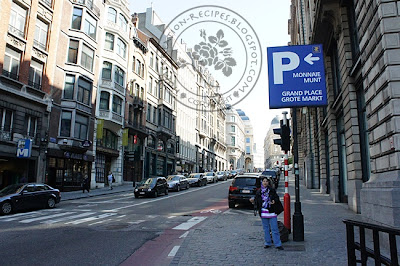
We did not plan for specific things to do in Brussels and thought will find out when we reach there. There was no tourist information from Botanique station except for metro map. So we gambled and decided to take a metro train to Gare Centrale (4 stations away from Botanique) to look for Grand Place. We took the wrong exit but we enjoyed walking through the city with beautiful architecture around us. Accidentally we saw a beautiful St Michel Cathedral after 15 minutes walk. The place was quite crowded with tourists.
 We saw the crowds walked towards one direction and decided to follow which then took us to the Grand Place (Grote Markt) which is Brussels central square. It was a very impressive landmark surrounded by magnificient 10th century architecture. Later I learned that they display flower carpet every two years and certainly not happening during our visit but we had opportunity to snap some nice spring flowers sold in pots below. By the way, the temperature on the day was hot, I think more than 25C - not what we anticipated.

 Grand Place is surrounded by lots of restaurants and there is one street which most restaurants serving almost the same menu with seafood specialties. I was attracted to try pot of mussels - it was huge so both of us shared and was surpised that we managed to finish it. It was served with fries and very delicious.
After whole day walking, my right lower carf was swollen and I was limping - not sure whether it was muscle or tendon problem but terribly painful. However, I got to go on (kesian kat Cik Liz if I stop and rest in he hotel) so limping slowly to tour Brussels at night to look for Mannekon Pis. After about 15 minutes walk from the metro station, we found it and to my disappointment the peeing boy statue was such a tiny size (smaller than a real human being) located at a corner of a shop. After taking photos, we went to look for dinner nearby (spaghetti served in huge wok but not that impressive taste) and later return to the same street (leading to Mannekon Pis) looking for hot chocolate and waffles. The waffles was very nice and a must have if anyone visiting Brussels.

We returned to the hotel about 11pm and repacking the luggage as we will be leaving Brussels for Germany in the next early morning train. So catch up the next story in Germany.

Why the level of unemployment matters nothing for real economic growth

Unemployment is a painful economic phenomenon which drives many social and political processes. For example, the Federal Reserve System has a dual mandate aimed at balancing of inflation and unemployment.  (In macroeconomic, there is no empirically derived link between these variables, however.) By definition, unemployment is treated as a crucial parameter which theoretically responsible for the level of real economic performance. When unemployment is high, real economic growth is considered as a suppressed one, and thus, below its potential value with some “natural” rate of unemployment.  In reality, economic recessions are usually accompanied by tangible increase in the rate of unemployment.  Economic logic is often faulty and says “in sync means interlinked”.   This is not the case for the relation between unemployment and real growth. Fluctuations in real growth are caused by external forces and result in the change of unemployment. This does not mean that one can decrease unemployment and thus drive economic growth.

The reason of the independence of real economic growth on unemployment is simple. The portion of unemployed, in the total working age population, UE/POP, is too small compared to the portion of people out of labor force, NLF/POP. Figure 1 displays both ratios. The portion of unemployed fluctuates near 4%  (mean value 3.8%) of the total population with amplitude of 2%. Currently, the portion of unemployed is around 6%. At the same time, the portion of people out of labor force has dropped from 42% in 1983 to 33% in 1999. Effectively, the economy included 10% more population in 2000 than in 1963. This is a much bigger change than the observed variation in the portion of unemployed. All unemployed in 2000 would be out of labor force in 1963, i.e. irrelevant to real economic growth according to the mainstream macroeconomic paradigm.

Figure 1. Comparison of the portion of unemployed, UE/POP, and the portion of people out of labor force, NLF/POP, in the total working age population, POP.
Now, it is instructive to evaluate the influence of the increasing portion of employed people, E/POP, on the rate of real economic growth. Figure 2 compares E/POP (reduced by 0.55) and the rate of GDP per capita growth, dGDP/GDP, where the overall real GDP is divided by the working age population, POP. One can see that the rate of growth has a negative trend since 1960. During this period the E/POP has increased from 55% to 63% and then dropped to59%.  From Figure 2, it is possible to conclude that the increasing proportion of employed population suppresses the rate of economic growth.

Figure 2. The portion of employed in the working age population, E/POP, compared to the rate of GDP per capita growth, dGDP/GDP.

Finally, we can answer the question why the level of unemployment means nothing for real economic growth. The fluctuations in UE are too small and their effect is opposite to the growth in the level of employment, which reduces the rate of real economic growth. In this regard, an increasing rate of unemployment is a positive phenomenon in the long run.

Support for Offshore Drilling Rebounds While Support for Nuclear Power Plummets

According to polls conducted by The Pew Research Center, public support for offshore drilling has been steadily increasing. Last month, 57% of respondents favored allowing more gas and oil drilling, which is up 13 points since last June. However, support for offshore drilling has not yet reached levels seen before the April 2010 spill in the Gulf of Mexico, after which support was as low as 44%. It is speculated that the rebound in support for drilling might be due to recent increases in gas prices.


While public support or offshore drilling has been increasing, support for increased nuclear power has been declining. According to poll results from The Pew Research Center, 39% were in favor of increased nuclear power use last month, which is down from 47% in favor last October. This decline in support could be correlated with the ongoing nuclear emergency in Japan.


References:

Pew Center on the States, Opposition to Nuclear Power Rises Amid Japanese Crisis, Support for Offshore Oil and Gas Drilling Rebounds (Washington, DC: The Pew Charitable Trusts, March 2011).


Posted by Brittany

First Day in Europe in Paris

 ok, friends here is the story (Paris part only) on my recent holiday trip and also to answer some questions received earlier. Don't be surprise that I actually went alone without my family along.... It was just me and a female friend....hehehe (sounds pelik ke....). My boss keep on reminding me that I deserve a real good break, somewhere away from Malaysia. My hubby been encouraging me to do so too and he said he can take care of the family without me (what a lovely husband and the best in the world). So it was a real break for me from everything in the office and home....

I departed from KL at almost midnight & reached Paris 6am in the morning. It took us quite a while to get a train from Parris des Gaulle airport to Hotel des Arts Bastille near Charonne metro station.It was 15 minutes walk from the station to the hotel but we were looking for it more than an hour before able to locate it. The most memorable part of the hotel is the lift which is the smallest lift I ever ride on (could also be the smallest hotel lift in the world...haha). It can only carry one person at a time even a person as petit as I am.....LOL. I do not have the picture of it because it is in my friend's camera which she has not yet downloaded for me.
Once we settled our luggage in the hotel, the first destination was the famous Eiffel Towel. We went there twice to have both day and night view. A very impressive gigantic lattice iron structure. Along the streets you can find many men selling Paris souvenirs like key chains, magnets, scarfs, t-shirts, etcs.
 The next destination was visiting Sacre Couer which is located at the highest point in the city. The nice thing about this place, you can have Paris city view once you reach the top staircase. Adjacent to it is art galeries with impressionist painters.

We also went to Montmartre not far from Sacre Couer where we had our lunch. It was a huge plate of chicken kebab from an Arabian restaurant. I only managed to eat half of it.
At night, we had pizza for dinner near the Eiffel Tower (photo with my friend). Although it was just a plain tomato & cheese pizza, it was very delicious - the aroma of the bread was really nice.
 Arc de Triomphe (nothing special but just photo taking to show that I've been there)

The most prestige shopping store in Paris is Printemps located in Boulevard Haussmann. I didn't buy many things apart from my blue Lancome eyeliner (that I've been using since the last 25 years and not sold in Malaysia) and perfume for UsusRaz. We didn't have much luxury of time to do proper shopping.

Early in the morning of the next day, we were in a train heading to Brussels. Watch out for the next update.

A share price model for Forest Laboratories between 2009 and 2011


Forest Laboratories (FRX), like Abercrombie & Fitch, also was one of the first companies with a stable and deterministic share price model estimated in September 2009 (back into November 2008).  This is a company from Healthcare subcategory of the S&P 500 list specialized in drugs manufacturing. We revisited this model in September and December 2010 and always found the same defining variables with almost the same time lags.
Our approach to deterministic share pricing (we have been tracking approximately 70 companies from S&P 500) is based on the decomposition of a share price into a weighed sum of two selected consumer price indices. For FRX, all models between 2009 and 2011 are defined by the (not seasonally adjusted) index of dairy and related products (DAIRY) and the price index of other household equipment and furnishing (OHEF), as reported by the US BLS. The former CPI component leads the share price by 3 month and the latter is 4 months ahead of the share price. Figure 1 depicts the overall evolution of both involved indices through March 2011.

In this post, we compare the 2009 and 2011 share price models for FRX. For the 2009 model we use the most recent defining CPIs, as available in April 2011, and the measured monthly closing prices through March 2011. This allows validating the initial model and demonstrating its reliability.  These models are as follows:

FRX(t) =  -0.53DAIRY(t-3) – 4.18OHEF(t-5)  - 13.41(t-1990) + 706.57 (September 2009)   

FRX(t) =  -0.61DAIRY(t-3) – 3.89OHEF(t-4)  - 11.65(t-1990) + 668.75 (March 2011)   

where t is calendar time. All coefficients are close with just minor variations related to the updated share prices. Therefore, the model is effectively the same between November 2008 and March 2011. In other words, we obtained a deterministic (leading by three months) model which was valid during 30(!) months.   Figure 2 illustrates the difference between the original and current models.  

The residual error is $4.40 for the period between June 2003 and March 2011. From the most recent model in Figure 2, we expect a fall to the level of $20 per share in 2011 Q2.

 
Figure 1. Evolution of the price of DAIRY and OHEF.


Figure 2. Observed FRX share prices and that predicted in 2009 and 2011. The early model has a larger time lag for the OHEF index which results in a slight underestimation of the share price in 2010 and 2011.  

Alcoa share price

Alcoa (AA) is a company from Materials subcategory of the S&P 500 list specialized in aluminum. According to our general approach to share price modeling we decompose the observed time history of the monthly closing AA stock price (adjusted for splits and dividends) into a weighted sum of two CPI components, time trend and free term.  Two defining CPI components are selected to minimize the model (RMS) error and may lead or lag behind the share.  

The AA model is defined by the (not seasonally adjusted) index of food away from home (SEFV) and the price index of rent of primary residence (RPR), as reported by the US BLS. The former CPI component leads the share price by 2 months and the latter is 4 months ahead of the share price. Figure 1 depicts the overall evolution of both involved indices through March 2011. It seems these indices have been evolving in sync since 2002 with the only step-like change in the SEFV in 2008.  The final empirical pricing model for AA is as follows:

AA(t) =  -6.71SEFV(t-2) + 3.34RPR(t-4)  + 19.23(t-1990) + 298.87

where AA(t)  is a share price in US dollars, t is calendar time. Figure 2 illustrates the observed and predicted models.  The residual error is $3.12 for the period between July 2003 and March 2011. One can expect the share price to hover at the level of $15 in the near future.  

Figure 1. Evolution of the price of SEVF and RPR.

Figure 2. Observed and predicted AA share prices.

Krugman's misinterpretation of long-term inflation

Paul Krugman has shown the evolution of headline CPI (level) since 2000 in order to demonstrate that the current trend manifests upcoming inflation. His conclusion is likely wrong due to couple mistakes in the presentation and interpretation.
  1. He narrowed the period to ten years and thus implied that the headline CPI trend was the same before 2000 and will be extended into the 2010s. Both assumptions are not true.
Figure 1 definitely shows that the trend before 2000 was different from the current one. Between 1980 and 1998, the headline CPI grew at a lower rate than the core CPI and they diverged. In 2000, the indices started to converge and the CPI curve intercepted the core CPI one in 2009. Very likely that the future trend will repeat that observed between 1980 and 2000, not continue the trend observed in the 2000s.
Therefore, the core CPI will be growing at a higher rate again and the headline CPI will sink below the core CPI level. Then the CPI inflation rate will be smaller than that defined by the core CPI. 


Figure 1.  Upper panel: The headline and core CPI levels between 1980 and 2011. Lower panel: the difference between the core and headline CPI demonstrates linear trends. One may expect the next trend to be positive and the headline inflation rate will be lower that the core inflation rate.  Krugman's assumption on the long-term trend in the headline CPI was not correct.

  1. The core inflation rate has been on decline since 2007, as Figure 2 shows. Despite very high volatility, the headline CPI always returned to the core CPI level. Our inflation model [1] shows that the current trend in the core CPI will be retained in the next decade below the zero line. Hence, the overall inflation rate will be also negative. An extended deflationary period will be observed.

Figure 2. The rate of price inflation as defined by the headline and core CPI.

  1. Kitov, I. (2006). Exact prediction of inflation in the USA, MPRA Paper 2735, University Library of Munich, Germany

Webcam

There is a web cam of the temple site.  Great idea!  I'm glad someone did it!

FOMC on inflation

Several days ago we presented a graph (see Figure 1) with headline and core (CPI) inflation which showed a downward trend in the core price inflation. Yesterday the Federal Open Market Committee (FOMC) issued a press release also addressing inflation among other topics. Specifically, the FOMC said:
…. Inflation has picked up in recent months, but longer-term inflation expectations have remained stable and measures of underlying inflation are still subdued…
The Committee will … continues to anticipate that economic conditions, …, subdued inflation trends, and stable inflation expectations, are likely to warrant exceptionally low levels for the federal funds rate for an extended period.
Hence, the FOMC is currently expecting that the surge in oil price will calm down and the CPI will fall back below the core CPI in the next few quarters. In Economic Projection, the expected central tendency of price inflation (PCE) in 2012 is between 1.2 and 2.0 per cent per year with the range 1.0 and 2.8 % per year. 
We still expect that the core CPI inflation will fall below the zero line in 2012 and the headline CPI will rebound from its current higher level below the core CPI manifesting a deflationary period in the US [1].

Figure 1. The rate of price inflation as defined by the headline and core CPI.
Kitov, I. (2006). Exact prediction of inflation in the USA, MPRA Paper 2735, University Library of Munich, Germany

Abercrombie & Fitch between 2009 and 2011

Abercrombie and Fitch (ANF) was one of the first companies with a stable and deterministic share price model estimated in September 2009.  This is a company from Services subcategory of the S&P 500 list specialized in apparel stores. We have revisited this model several times since 2009 and always found the same defining variables. The model is based on the decomposition of a share price into a sum of two selected consumer price indices. All models are defined by the (not seasonally adjusted) index of pets, pet products and services (PETS) and the price index of transportation services (TS), as reported by the US BLS. The former CPI component leads the share price by 1 month and the latter is 4 months ahead of the share price. Figure 1 depicts the overall evolution of both involved indices through March 2011.
In this post, we compare the 2009 and 2011 share price models for ANF. For the 2009 model we use the most recent defining CPIs as available in April 2011 and the measured monthly closing prices through March 2011. This allows validating the initial model and demonstrating its reliability.  These models are  as follows:
ANF(t) =  -4.56PETS(t-1) – 2.96TS(t-4)  + 47.09(t-1990) + 544.90 (September 2009)   (1)
ANF(t) =  -4.74PETS(t-1) – 2.45TS(t-4)  + 44.47(t-1990) + 494.79 (March 2011)   (2)
where t is calendar time. All coefficients are very close with just minor variations related to the updated share prices. Therefore, the model is effectively the same between January 2009 and March 2011. In other word, we obtained a deterministic (leading by one month) model which was valid during 27(!) months.   Figure 2 illustrates the difference between the original and current models.  
The residual error is $5.88 for the period between June 2003 and March 2011. One can expect a fall in the share price. Otherwise, the model will fail in the near future after 2 successful years.  
 
Figure 1. Evolution of the price of PETS and TS.


Figure 2. Observed ANF share prices and that predicted in 2009 and 2011.

Chesapeake Energy stock price model

Another successful example of an energy company with a stable pricing model is Chesapeake Energy Corporation (CHK). Here we present a new price model for CHK using an extended set of 92 CPIs. It is an example with a share price leading defining components of the CPI.  As always, the model is seeking for two CPI components which minimize the difference between observed (monthly closing price adjusted for dividends and splits) and predicted prices for the period between July 2003 and March 2011.

The two-component (2-C) model also includes free term (constant) and linear time term which compensates well known linear (time) trends between various CPI components. The best-fit 2-C model for CHK(t) is based on the index of tuition, other school fees, and child care (TUIT) contemporaneous with the share, and the index of energy (E) lagging by 2 months:

CHKN(t)= 0.52TUIT(t-0) + 0.43E(t+2) – 16.771(t-1990) – 21.48; stdev=$2.64    

where (t-1990)  is the elapsed time. Therefore, the predicted curve should lag the observed price by 2 months. In other words, the price of a CHK share defines the behaviour of the index of energy. Figure 1 depicts the observed and predicted price; the latter is shifted three months ahead for synchronization. The model residual error, i.e. standard deviation, is of $5.54for the period between July 2003 and January 2010.

Figure 1. Observed and predicted CHK share prices.

The State of Recidivism

Earlier this month the Pew Center on the States released State of Recidivism: The Revolving Door of America’s Prisons, a comprehensive report on trends in state recidivism rates. A recidivism rate refers to the proportion of individuals released from prison that are rearrested, reconvicted, or returned to prison within a specified time period. Offenses which result in a return to prison fall into one of two categories: 1) committing a new crime and subsequently receiving a new conviction or 2) violating a technical condition of supervision, such as failing to report to one’s parole or probation officer. Overall, more than four in ten offenders are returned to prison within three years of being released. Thirty-three states reported data for both 1999 and 2004; 17 states reported a decrease in recidivism rates over the five-year period and 15 states reported an increase. Rates in Oregon fell more than rates in any other state, reporting a 31.9 percent decrease. Overall, general recidivism rates showed little variation over the five years, with 45.4 percent for individuals released in 1999 and 43.3 percent for those released in 2004. The report vocalizes a need for improving supervision, citing that although crime rates continue to decline, the rates of reincarceration for committing a new crime increased by 11.9 percent over the five-year period. This increase is somewhat balanced out by the 17.7 percent drop in the rate of offenders reincarcerated for technical violations.

Pew Center on the States and those involved in publishing this report caution readers not to compare recidivism rates across states. There are many variables between different states that might affect recidivism rates differently; rates cannot be used as an accurate way of comparing the success of states’ respective corrections agencies. Pew worked with two opinion research firms, Public Opinion Strategies and Benson Strategy Group, to measure public opinion about recidivism.

Voters were most concerned with public safety and protection, advocating that a better job needs to be done in making sure that persons who are released are less likely to commit crimes. Voters showed strong support for reducing the length of incarceration for nonviolent prisoners who participate in programs that may help to reduce recidivism, such as substance abuse treatment programs. Voters also supported shorter sentences for nonviolent inmates who demonstrate good behavior and are at minimal risk of reoffending.

See full report 1,200 registered voters were interviewed by phone on March 7-14, 2010. Results have a margin of error of ±2.83%.

References:

Pew Center on the States, State of Recidivism: The Revolving Door of America’s Prisons (Washington, DC: The Pew Charitable Trusts, April 2011).


Posted by JVSF

2011 Research Paper Competition winners announced

ICPSR is pleased to announce the winners of our 2011 Research Paper Competitions.

Tommaso Pavone won the first-place award in the Undergraduate Competition with his paper "Do More Parties Make for Happier Voters?" which can be viewed at: http://www.icpsr.umich.edu/files/ICPSR/prize/pavone.pdf . Pavone, a student at the University of Michigan, conducted a cross-national analysis of public opinion data from 36 democracies to study whether more political parties correlates to higher voter satisfaction.

The second-place undergraduate winner was Erin McMichael of California State University - Northridge, whose paper is titled "External versus Internal Motivators as Predictors for LGBTQ-Directed Bullying Behavior in Adolescents," which is available here: http://www.icpsr.umich.edu/files/ICPSR/prize/mcmichael.pdf .

Sayon Deb of Boston University won first place in the Master's Competition with his paper "The Long Term Effects of Colonial Land Tenure: Micro Evidence from India" which can be accessed here: http://www.icpsr.umich.edu/files/ICPSR/prize/deb.pdf . The paper uses household survey data from India to examine the impact of historic land tenure institutions on economic and social outcomes for households today.

Douglas Rice of Pennsylvania State University won second place in the Master's Competition for his paper "The Impact of Supreme Court Activity on the Judicial Agenda: Calling to Action or Settling the Law." The paper is available through ICPSR: http://www.icpsr.umich.edu/files/ICPSR/prize/rice.pdf .

The winner of the Resource Center for Minority Data Paper Competition was Whitney Boyer of Washington University in St. Louis for the paper titled "Educational Outcomes for Latino Immigrants in Los Angeles County: The Importance of Gender, Immigrant Generation, and Mother's Educational Level," which is viewable at this url: http://www.icpsr.umich.edu/files/ICPSR/prize/Boyer.pdf. The RCMD archive can be accessed here: http://www.icpsr.umich.edu/icpsrweb/RCMD/ .

The first-place winners received $1,000; the second-place prize is $750. All the papers used data from the ICPSR or RCMD archive.

ICPSR is holding three competitions this year:

•The ICPSR Research Paper Competition, for analyses on any topic using data from the ICPSR General Archive or Thematic Collections.
•The IFSS Research Paper Competition, for analyses on any topic using data from the Integrated Fertility Survey Series.
•The RCMD Research Paper Competition, for analyses on issues relating to minorities in the United States, including immigrants, using data from the Resource Center for Minority Data.

All competitions are open to undergraduate and master's students, and recent graduates. Deadline for submissions is January 31, 2012.

Full details on the 2012 Research Paper Competition can be seen here: http://www.icpsr.umich.edu/icpsrweb/content/ICPSR/prize/index.html .

Asam Pedas Fish

 I missed home cooking so much after the Europe tour....LOL. The food in Europe were fabulous (I'll share the foods we had in Europe soon) but being the typical Malay, I longed for rice and dishes so much. So, as soon as my head was clear, I started cooking again and ya Allah this Asam Pedas is heaven....hahaha (bunyi orang kemaruk...hehehe).
I've posted several Asam Pedas recipes before and this one is slightly varied.

Source: Roz@HomeKreation
INGREDIENTS:
More/Less 700g Fish
5 Shallots*
2 cloves Garlic*
1/2" Ginger*
2cm Belachan*
2" Turmeric Root*
1 tsp Coriander Seeds*
1 tsp Fennels*
1 tsp Cumin* (* blend with some water) 
1 Lemongras - bruised 
6 tbsp Chili Paste
1 tbsp Tamarind Paste - mix into 1 bowl of water
1 Ginger Flower (I used dried one) 
2 Tomatoes - cut 
2 tsp Sugar
Salt

METHOD:
1. Heat up 1 scoop of oil and stir fry blended ingredients & lemongrass until fragrant.
Add in chili paste & continue stir fry until fragrant.
Add in tamarind juice, ginger flower, sugar & salt and let it boil.
Add in fish & tomato.
Cook until fish is done.

2. Serve with omelet, veg and white rice.
***************************************

BAHASA MALAYSIA VERSION
Ini lauk orang tengah kemaruk nak makan nasi....hehehe

BAHAN2:
+/- 700g Ikan Isi
5 ulas Bwg Merah*
2 ulas Bwg Putih*
1/2" Halia*
2cm Belacan*
2" Kunyit Hidup*
1 st Biji Ketumbar*
1 st Biji Jintan Manis*
1 st Biji Jintan Putih* (* blend dgn sedikit air) 
1 btg Serai - ketuk
6 sb Pes Cili
1 sb Asam Jawa - perah dlm 1 mangkuk air
1 kuntum Bunga Kantan (Along guna yg kering) 
2 biji Tomato - potong
2 st Gula
Garam

CARA2:
1. Panaskan 1 senduk minyak & tumis bhn blend & serai sehingga wangi.
Masukkan pes cili & tumis lagi sehingga wangi.
Masukkan air asam jawa, gula & garam dan biar menggelegak.
Masukkan ikan & tomato.
Biar sehingga ikan masak sempurna..

2. Hidangkan dgn telur dadar, sayur & nasi putih.

Wal-Mart share in 2011 (update)

We  estimated a price model for Wal-Mart Stores(WMT) three months ago. The model is based on the decomposition of a share price into a sum of two selected consumer price indices. This is a new model defined by the index of hospital and related services (HOSP) and the price index of miscellaneous personal services (MISS), as reported by the US BLS. The former CPI component leads the share price by 10 months and the latter one evolves in sync with the price. Figure 1 depicts the overall evolution of both involved indices through March 2011. A very specific feature of both indices is their linearity over time: they are close to straight lines.

In this post, we re-estimate the WMT share price using new data for the first quarter of 2011. This allows validating the initial model and demonstrating its reliability. The previously obtained defining components are the same and provide the best fit model between June 2010 and March 2010 with only one month change in the lag for the HOST index.  All coefficients in (1) are only slightly different for the new model (see below).  The slope of the time trend is negative. The best-fit 2-C model for WMT(t) is as follows:

WMT(t) =  0.50HOSP(t-10) + 1.42MISS(t)  - 28.39(t-1990) – 158.12 (January 2011)   (1)

WMT(t) =  0.46HOSP(t-9) + 1.49MISS(t)  - 28.03(t-1990) – 165.50 (March 2011)

where t is calendar time. The predicted curve in Figure 2 evolves in sync with the observed price. The residual error is $2.15 for the period between June 2003 and March 2011. One can expect just slight variations around the $50 level since linear growth in HOSP and MISS is effectively compensated by the negative time  trend in (1).

Figure 1. Evolution of the price of HOSP and MISS.

Figure 2. Observed and predicted WMT share prices.


Figure 3. Residual error of the model.

Blog Archive