Approval Rates of Black and White Marriage


A recent article from Gallup based on their Minority Rights and Relations poll, conducted June 13-July 5 which surveyed 4,373 Americans, including 1,010 non-Hispanic Blacks reports one of the largest shifts of public opinion in Gallup history, 87% of Americans now favor marriage between Blacks and Whites, up from 4% in 1958. The report explained its findings:
Approval of marriages between Blacks and Whites is up one percentage point from 2011, when this attitude was last measured. Approval has generally increased in a linear fashion from Gallup's first measure in 1958, reaching the majority threshold in 1997, and crossing the three-quarters line in 2004. Eleven percent of Americans today say they disapprove of Black-White marriage, compared with 94% who disapproved in 1958.

Blacks' approval of Black-White marriage (96%) is now nearly universal, while Whites' approval is 12 percentage points lower, at 84%. Blacks' approval has consistently been higher than Whites' over the decades, although attitudes among both racial groups have generally moved in a parallel manner since 1968, when Gallup was first able to report reliable estimates of each group's opinion. The gap between Black approval and White approval in recent years has been smaller than it was prior to 1997.


Read the full article here:  http://www.gallup.com/poll/163697/approve-marriage-blacks-whites.aspx

Marriage Still in Recession


The Pew Research Center released a new report detailing the continued decline of marriage in 2011.  Using data collected by the Census Bureau's American Community Survey, Pew reported on the 4.2 million Americans who tied the knot in 2011.  This continues the downward trend in marriage that began when the ACS began asking about marital status in 2008.

Half (51%) of all adults were married in 2011, as compared with 72% in 1960.  This downward trend occurred among all age and education groups, with the largest drop occurring among the less-educated.  Between 2008 and 2011, marriage among Americans without a high school or equivalent education fell by 14%, while those with a college degree only fell 10%.

Violent Child Abuse On the Decline


A special report from the U.S. Department of Justice’s Bureau of Justice Statistics finds that during 2010 roughly 2.8 million “children age 17 or younger… lived in a household in which at least one member age 12 or older experienced one or more nonfatal violent victimizations during the year.”  The data does not specify whether the child was present during the abuse or whether he was the victim of the attack, but it does provide insight into how diminished, yet still widespread, the issue violent crime against children is.  In 2010, 3.9% of children fell into the category of having lived in a household where violent child abuse took place, but this percentage has fallen over 68% since 1993, when approximately 8.7 million children, or 12.6%, lived in a household that experienced violent victimization.  Violent crimes occurred in low-income households (less than $15,000 a year) and in urban areas.  Additionally, households headed by one parent or a nonmarried adult were more prone to experiencing violent child victimization.

In Response to Gay Marriage Support, 1 in 4 Americans View the President Less Favorably

Following President Obama’s endorsement of legalized gay marriage, the Pew Research Center released a survey on how the announcement has affected Americans’ opinions of the President.  Overall, 52% say their opinion has not changed, 25% say they now view the President less favorably, and 19% say they view the President more favorably.  Many in the media suspected the African American community’s support of President Obama would decrease; however, the survey shows that 68% of African Americans were unaffected by the announcement, 16% view the President more favorably, and 13% view the President less favorably.  Among young adults ages 18-29, and adults aged 30-49, 22% view the President more favorably.  These two age groups were the most likely age groups to view the President more favorably with the announcement.  Among seniors aged 65 and over, 42% now view the President less favorably.

Half of Americans Support Legal Gay Marriage

Gallup ran a poll on May 8th which determined that fifty percent of Americans support legal gay marriage.  This percentage dropped three points since last year; however, this year marks just the second year since Gallup began tracking this question that at least 50% of Americans supported legal gay marriage.  On the other hand, 48% believe gay marriage should not be permitted.  In 1996, when Gallup first began tracking the gay marriage debate, only 27% supported legalizing gay marriage and 68% were opposed.  65% of Democrats believe gay marriage should be legal, while only 22% of Republicans approve.  This stark contrast between political parties characterizes the hotly contested debate in America, and this poll underscores the divisiveness of the issue.

Cultural Inequality in the U.S.

In a recent Wall Street Journal article, Charles Murray discusses the emergence of what he refers to as “cultural inequality” in the U.S. since the 1960s. According to Murray, this cultural inequality is a result of the formation of a “new upper class” and “new lower class” that no longer share an “American way of life.” Among the qualities that Murray uses to define this so-called American way of life are marriage, male employment, religion and marital births. The interactive graphic from the article shows statistics relating to all of these items for people aged 30-49 that are defined as upper middle class (“with at least a college education working in managerial jobs or high-status professions”) and working class (“with no more than a high school education in blue-collar, low-skill or service jobs”) from the 1960s/1970s and the 2000s. The data seem to support Murray's concept of a new cultural inequality in the US, as more members of the working class appear to have fallen away from the “American way of life” than members of the upper middle class over the last 4 or 5 decades. For example, while the marital rate of the upper middle class have fallen from 94% to 83% since 1960, the marital rate of the working class plummeted from 84% to 48% over the same time period. A similar trend can be seen in the rest of the graphic, with the working class experiencing a larger percentage increase in males with jobs working fewer than 40 hours per week and a larger percentage increase in those calling themselves non-religious.


U.S. marriage rate hits a record low


The Pew Research Center released an analysis of new 2010 U.S. Census data on marriage, which shows a record low in the percentage of married U.S. adults.  Only 51% of adults ages 18 and over reported being married, down from 72% in 1960.  Over the same 50-year period, divorce or separation has increased from 5% to 14%, and the percent never married increased from 15% to 28%.

The most telling trend in terms of marital trends can be found in the young adult population.  Twenty percent of those ages 18 to 29 reported being married, just over one third of the percent married 50 years ago (59%).  In addition, the median age of first marriage has increased by roughly six percent over this time period, up to roughly 28 years old.

Though Pew does not definitively explain the declining trends in marriage, they cite the rising share of young adults enrolled in college and “fallout from the Great Recession” as potential contributing factors.  Pew also cites a U.N. report on marriage in developed nations between the 1990s and 2000s, quoting: “this was ‘due in part to an increasing acceptance of consensual [cohabiting] unions as a replacement for marital unions,’” which may also contribute to declining percentages in the United States.

As Men Live Longer, Fewer Older Women Live Alone

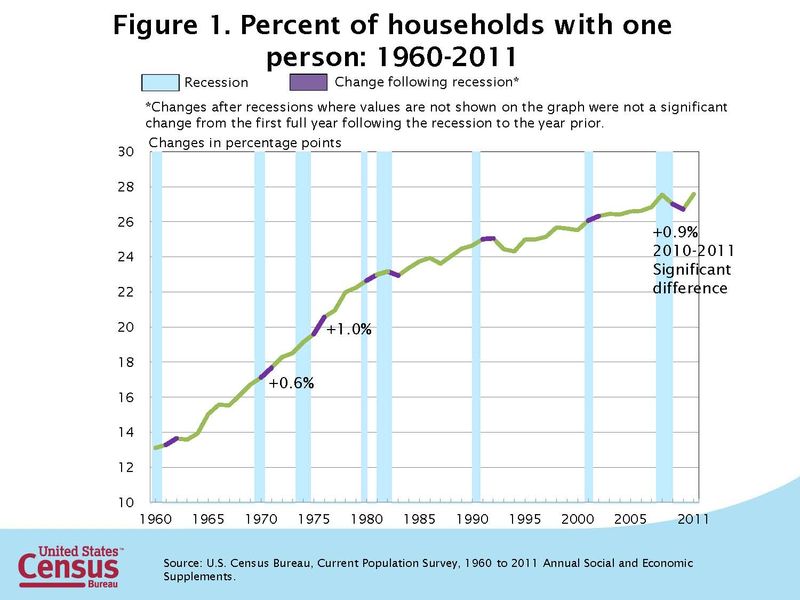
Random Samplings, the U.S. Census Bureau's official blog, recently reported that women are less likely to live alone today than they were a generation ago. Rose Kreider writes: "The increase in life expectancy for men is likely...connected to the decrease in living alone for older women." Because men are living longer, fewer women are widowed; as a result, "the proportion [of women] married and living with their spouse increased from 1971 to 2011."

Interestingly, from 2008 to 2010, there was a 0.8 percent decrease in one-person households, standing out from a generally upward trend in the percentage of one-person households "
over the last half of the 20th century and into the 21st century." Kreider warns against assuming the decrease was due to the recession, noting that in the past, the percentage of one-person households "doesn’t look like it is necessarily sensitive to recessions." Rather, it appears that this decrease is more closely related to the rising life expectancy of men, which has increased from 67 years of age in 1971 to 75 in 2007.

NH cf

All The Single Ladies


An article published Friday in The Economist discusses the decline of the marriage rate of the black population and its implications for black women. As the below chart from the article indicates, the percentage of black adults married had decreased more rapidly than that of the white and Hispanic populations since 1970; as of 2010, the rate is down to about 40%. The article quotes Stanford professor and author of "Is Marriage for White People? How the African-American Marriage Decline Affects Everyone," who believes that a "man shortage" is at the heart of the issue. According to the article, roughly one in ten black men in their early thirties are incarcerated and black men have "fallen behind in education and income" relative to black women, with two black women graduating from college for every black man. As the group that "least intermarries with other races," black women are left with limited marital options and consequently, seven out ten are single.


cf

Marriage in Asia


A recent article in The Economist explores the decline in marriage rates in Asia, as well as its causes and potential consequences. The first graph from the article (right) shows an upward trend in the average marriage age of women since 1970 in India, Indonesia, South Korea, Japan and Hong Kong. As the graph shows, the average marriage age of women was about 28-30 in Hong Kong, Japan and South Korea in 2005. This is higher than in the US, where the average age of marriage in the US is about 26, according to the article.


The second graph shows a dramatic increase in the percent of 35-39 year-old women that were unmarried in Hong Kong, Taiwan, South Korea, Japan and Singapore. The growing number of unmarried women in their late 30s suggests that not only are women getting married later, but less women from these countries are ever getting married. One cause of the increasing number of unmarried women in these countries is an increase in education, employment and income of women. The article sites a survey conducted in Beijing in 2003 that found that half of women with a monthly income of 5,000-15,000 yuan (about $600-$1,800) were unmarried. Half of these unmarried women respondents said they did not need to be married because they were financially independent. The article also points out that the marriage rate of women declines with every level of education in Asian countries, with university graduates least likely to marry. According to the article, Asian women with higher levels of education and income face a larger opportunity cost of giving up a career to have children, leading many to choose work, .


China and India, Asia's two largest countries, seem to be less affected by this decline in marriage rates as they have shown only slight increases in the percentage of unmarried women in their late 30s since 1970. While women may not be growing more hesitant to marry like they are in surrounding countries, there will simply be less women to marry due to the distorted sex ratios already present in both countries. Largely a result of sex-selective abortion, a process in which "parents use pre-natal screening to identify the sex of the fetus and rid themselves of daughters," there were more than 118 boys born for every 100 girls in China and 109 boys born for every 100 girls in India in 2010, according to the article. The article sites studies done by Avraham Ebenstein of Harvard University and Ethan Sharygin of the University of Pennsylvania, which project that by 2030, 8% of Chinese men aged 25 and older will be unable to marry because of the country's distorted sex ratio and about 10-15% by 2050. These projections are also shown in the second graph (right).

BL cf

Blog Archive