According to data recently released from the U.S Census Bureau and analyzed by the Pew Research Center, 2009 to 2011 (sometimes thought of as the first two years of the recovery) saw mean net worth gains of 28% for the top seven percent of households. The lower 93%, however, saw net mean losses of 4%. Putting numbers to the percentages, that accounts for 8 million households in the top seven percent and 111 million households in the bottom 93%.
According to Pew, these difference occurred owing to the changes between the stock and bond market and the housing market; more affluent families tended to have financial holdings in the stock and bond markets, while less affluent families wealth tends to be stored in their homes. The ensuing difference in markets let to the top seven percent of households owning 63% of the nation's aggregate wealth in 2011, which was an increase from 56% in 2009.
Low-cost Airline Usage
If air travel is your method of choice, there's no cheaper way than airlines like Southwest Airlines or Ryanair. Low-cost carriers are used more frequently and are relatively inexpensive -- unless you've got to reschedule that flight, need to carry more luggage, or violate any of a host of fees that add to the ticket's cost.
The Economist, via Amadues, has released a map detailing the range of countries that rely most heavily on low-cost airline services. Countries that are more red have a higher percentage of citizens that rely on the cheaper alternatives to flying.
The Philippines were the nation with the largest percentage of citizens using budget airlines at 65% of all passengers using these services. Russia, Japan, and China all had markedly low use, at 5%, 4%, and 1% of passengers using budget carriers, with China's fierce protection of the nation's three major airlines being cited as reasons for low participation.
The Economist, via Amadues, has released a map detailing the range of countries that rely most heavily on low-cost airline services. Countries that are more red have a higher percentage of citizens that rely on the cheaper alternatives to flying.
The Philippines were the nation with the largest percentage of citizens using budget airlines at 65% of all passengers using these services. Russia, Japan, and China all had markedly low use, at 5%, 4%, and 1% of passengers using budget carriers, with China's fierce protection of the nation's three major airlines being cited as reasons for low participation.
56% of Americans are Averse to Filing Taxes
While not exactly groundbreaking, Pew Research Center released a poll detailing that a majority (56%) of Americans do not care for doing their taxes. Of those averse, 26% hate it and 30% merely dislike the annual chore. 29% say they like it and a small sliver of Americans even enjoy filling out their income taxes (5%).
Reasons for elation include the refund that's sure to come, one's own skill for filling out taxes, a sense of control, and even the duty to play a fair share to the system. On the other hand, reasons for consternation include the inherent complications, the time consuming nature, and a marked disfavor with the government's use of tax money.
Across partisan lines, Democrats are much more likely to enjoy doing their taxes than Republicans, with 40% of Democrats enjoying taxes and 32% disliking the task. Independents are even less likely to feel joy at the prospect of taxes, with only 31% responding favorably. Republicans are more likely than either Democrats or Independents to see a failure to report all income as "morally wrong" (at 78%, 68%, and 69% respectively).
Reasons for elation include the refund that's sure to come, one's own skill for filling out taxes, a sense of control, and even the duty to play a fair share to the system. On the other hand, reasons for consternation include the inherent complications, the time consuming nature, and a marked disfavor with the government's use of tax money.
Across partisan lines, Democrats are much more likely to enjoy doing their taxes than Republicans, with 40% of Democrats enjoying taxes and 32% disliking the task. Independents are even less likely to feel joy at the prospect of taxes, with only 31% responding favorably. Republicans are more likely than either Democrats or Independents to see a failure to report all income as "morally wrong" (at 78%, 68%, and 69% respectively).
Support for Same-Sex Marriage On the Rise
In the past decade, support for gay marriage has been steadily on the rise. According to a comprehensive report done by the Pew Research Center for the People and the Press, this steady increase has been defined by the generational gap, although all generations have seen increases in support for same-sex marriage.
The Millennial Generation (those born after 1980) has seen the most dramatic shift, rising from 51% favoring legalized same-sex marriages in 2003 to 70% in 2013. In addition to the substantial increase, the Millennial Generation also makes up a larger percentage of the adult population now than it did in 2003 (tripling from 9% to 27%).
Millennials have not been alone in coming around to legalizing same-sex marriages. The Silent Generation (1928-1945) has almost doubled its rate of support over the same span of ten years, increasing from 17% to 31%. Baby Boomers (1946-1964) and Generation X (1965-1980) have seen more modest increases in support from 33% to 38% and 41% to 49%, respectively.
To deepen the understanding of shifting attitudes, surveyors asked respondents whether their views on same-sex marriage had changed or if it had always been that way. One-in-seven (14%) of the entire population have changed their minds to support same-sex marriage (this accounts for 28% of all proponents of same-sex marriage). The main reason for changing one's mind, according to respondents, was knowing someone who was homosexual (32%), while a close second was personally growing more open (25%). Be sure to check out the rest of the report, which shows larger societal responses to homosexuality in general, shifting responses to gay rights issues,and changing religious stances.
The Millennial Generation (those born after 1980) has seen the most dramatic shift, rising from 51% favoring legalized same-sex marriages in 2003 to 70% in 2013. In addition to the substantial increase, the Millennial Generation also makes up a larger percentage of the adult population now than it did in 2003 (tripling from 9% to 27%).
Millennials have not been alone in coming around to legalizing same-sex marriages. The Silent Generation (1928-1945) has almost doubled its rate of support over the same span of ten years, increasing from 17% to 31%. Baby Boomers (1946-1964) and Generation X (1965-1980) have seen more modest increases in support from 33% to 38% and 41% to 49%, respectively.
To deepen the understanding of shifting attitudes, surveyors asked respondents whether their views on same-sex marriage had changed or if it had always been that way. One-in-seven (14%) of the entire population have changed their minds to support same-sex marriage (this accounts for 28% of all proponents of same-sex marriage). The main reason for changing one's mind, according to respondents, was knowing someone who was homosexual (32%), while a close second was personally growing more open (25%). Be sure to check out the rest of the report, which shows larger societal responses to homosexuality in general, shifting responses to gay rights issues,and changing religious stances.
All Time Low for "Strong" Catholic Identity
Since the conception of a religious strength question in 1974, the General Social Survey (GSS) has never measured a lower amount of U.S. Catholics that are self-described as "strong" Catholics. Pew reports that in 2012, the amount of Catholics claiming strong religious identity was 27%. "Strong" Protestant religious identity has been rising in recent years and was found to be almost double the Catholic numbers with 54% of Protestants claiming strong religious identity in 2012.
In addition, the GSS reveals that both among Protestants and Catholics there are marked correlations between strength of religious identity and church attendance; strong Catholics attend Mass more often than Catholics as a whole with the same trend being apparent for Protestants. However, strong Catholic respondent's attendance (regular attendance being described as attendance once a week to Mass) has been waning, falling from 85% in 1974 to 53% in 2012. Protestant fluctuations do not reveal any strong trends, with 55% of strong Protestants attending church once a week in 1974 and 60% in 2012. When broken down, Protestant divisions show revealing trends. Evangelical and Black Protestants identify with strong religious identities (57% and 69%, respectively). Only 35% of Mainline Protestants claim strong religious identity.
States of Medicaid Expansion
According to the New York Times, 22 governors have committed to expanding their state's Medicaid program, including seven states with Republican governors. In the wake of the 2012 Supreme Court decision that made an expansion of government-sponsored health care for lower-income people a state decision, Medicaid expansion has been a polemic issue at the state level.
The federal government has agreed to pay all costs of such an expansion from 2014 to 2016, afterwards paying 90% for an unspecified time, but some governors were not swayed. Nevada, Arizona, New Mexico, North Dakota, Michigan, Ohio, and Florida are the seven states with Republican governors that now voice support for the bill. These changes of heart are due to government funding, consumer advocacy, and the health care industry. Many hospitals are voicing support for the expansion, claiming that the less expensive Medicaid insurance will make up whatever losses the hospitals might incur by the volume of the newly insured. Were all 22 states to choose to expand Medicaid, the 60 million covered by Medicaid currently would increase to 77 million insured people.
Good Weather for the Global Economy?
The Economist has released an interactive barometer that reports the perceived forecast for the global economy (as rated by more than 1,500 senior executives). By clicking on dates on the line graph, the barometer will change to correspond to the global business outlook at the time. By clicking on the regions to the right of the line graph, new bars will appear to represent the chosen region. In addition, the interactive feature allows the user to select the confidence by selected industry. The third tab entitled "In Focus" focuses on two questions: "Is the euro crisis over?" and "How would you describe current regulation of the banks?"
The Economist has gleaned from this information that since the last quarter of the 2012 approval ratings concerning the global economy have risen from -11% to 7% in the first quarter of 2013. This optimism carries over into the transport and tourism sectors of industry, but turns negative in the IT, technology and government sectors. Finally, an overwhelming majority of respondents do not believe the euro crisis is over and around half respond that the current bank regulations have not gone far enough.
Stats of the Union
The Economist recently released an interactive map under the heading "Stats of the Union", featuring several measures of the United States ranging from unemployment rates to measurements of the under-18 population. At the national level, averages from each state appear underneath the map. For certain measures, clicking on the desired state will produce a breakdown of the chosen measure.
Along with this map, The Economist summarizes that the unemployment rate has stabilized, with nineteen states recording decreases. Despite the shrinking national economy (of .1% in last year's fourth quarter), personal income has increased in all states, and all but eight saw increases in their state economy.
World's Most Expensive Cities
With Tokyo topping the list once again, the Economist Intelligence Unit released this chart analyzing the cost-of living index. Beating out Zurich which achieved the number one spot last year due to its currency strength, Tokyo occupies the same place this year it has had fourteen times in the last twenty years.
New York forms the basis for comparison and is anchored at one hundred for reference, though up nineteen places from last year, reaching spot 27. The scale is determine on the weighted average of 160 goods and services in each city.
In the past decade, cities that have seen strongest growth are Caracas and São Paulo (however, Caracas is seen to decrease to the level of Mumbai and Karachi when corrected for high inflation). The past ten years have spelled out the most decline for Detroit and Panama City.
New York forms the basis for comparison and is anchored at one hundred for reference, though up nineteen places from last year, reaching spot 27. The scale is determine on the weighted average of 160 goods and services in each city.
In the past decade, cities that have seen strongest growth are Caracas and São Paulo (however, Caracas is seen to decrease to the level of Mumbai and Karachi when corrected for high inflation). The past ten years have spelled out the most decline for Detroit and Panama City.
Seasonal Spike in Jobless Claims
Americans seeking unemployment aid rose sharply in the past week. According to the Associated Press, 38,000 Americans filed for unemployment, making the seasonally adjusted total 368,000. In addition, the number of applications fell by 45,000, reaching a five-year low. Reasons for the increased amount of unemployment is the termination of seasonal retail work. As such, it hasn't caused much alarm among economists, who are projecting that January's job report will show that 155,000 more jobs were added and that the employment rate will remain constant at 7.8%.
The article suggests that steady hiring will counter the contraction of the national economy that has been caused by decreased military spending and fewer exports. Positive signals for the economy include increases in consumer spending (which accounts for 70% of activity), business investments in equipment and software, and rising housing prices.
U.S. Immigrant Population Continues to Grow
According to Pew Research Center, the immigrant population in the United States was 40.4 million, a record high for the country. In 2011, the 13% of immigrants living in the United States was slightly lower than the nation's peak at 15%, which occurred between 1890 and 1920. The 40.4 million immigrants in the United States are distinctly comprised of Latin Americans (50%) and Asians (27%), as opposed to the influx of European immigrants in the period between 1890 and 1920.
The population of unauthorized immigrants, a segment of the 40.4 million immigrants in the United States, were down slightly since 2007, from 12 million to 11.1 in 2011. Highlighting other trends relating to unauthorized immigration, Pew links to further analysis in other articles, which can be found here.
Efficacy of Kickstarter
To analyze the efficacy of Kickstarter campaigns, The Economist analyzed the money raised, the average pledge, and the success rates of various campaigns on the crowdfunding website. What they found was that $320 million was raised over the course of 18,000 successfully funded projects; 2.2 million donors made possible around half (44%) of proposed projects that traverse a huge range of categories. Of these categories, board, card, and video games raised the most money with $83 million raised over the course of 900 projects. Fashion projects were only successful about a quarter of the time (26%), while Dance projects topped the charts at 74%. The website, like many of the projects, is quite the success story, raising more than 200% as compared with 2011 with continued expected growth throughout 2013.
Business Subsidies throughout the US
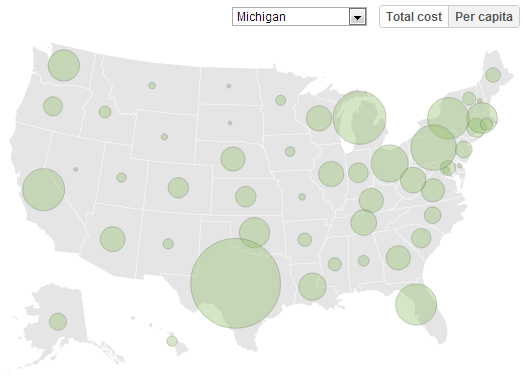
The New York Times compiled a database of incentives granted by cities, counties, and states to businesses. Across the country, various levels of government granted $80.4 billion across 1,874 programs created to promote business. The state with the highest percentage of business incentives per dollar in the state budget was Texas, with $0.51 for every dollar going to business incentives. The states with the largest spending per capita were Alaska, West Virginia, and Nebraska (with $991, $845, $763 per capita respectively -- Texas ranked close with $759 per capita).
In addition, this resource lists the programs that each states employ and the companies that receive the most from these programs (to begin by looking at Texas, click here). The New York Times also compiled a list of the 48 companies that gained more than $100 million since 2007 due to these programs; companies that topped the list of 48 were GM, Shell, and Ford, although some 5,000 more companies received more than $1 million in grants in the same time frame.
Lagos to Overtake Cairo as Largest African City
According to The Economist, Lagos will grow to be the largest African city in 2013, overtaking Cairo by some 0.3 million. While this shows the suspected shift from the ends of Africa to the center of the continent, the combined GDP of Cairo, Johannesburg, and Cape Town are still greater than Western and Eastern Africa combined.
In addition, Kinshasa will grow to have 15 million people in the next decade and Lagos will have 16 million in the same time frame. Due to their rapidly expanding population, these growing cities will be be forced to create jobs with little infrastructure. In addition, over half of their inhabitants will be under 18.
Police Presence and Mental Health are Key Concerns Regarding School Violence
In response to the school shooting in Newton, Connecticut, Gallup asked Americans what they thought would be the most effective in a series of options to curb similar violence. The top three choices show that the majority of respondents think that increasing police presence, increasing mental health screening and treatment, and decreasing gun violence in the media should be key concerns of policymakers that are responding to the tragedy in Connecticut.
The ensuing debate has centered on gun control and this poll reveals more contention on this issue, as compared with the top three responses. 42% believe that banning the sale of assault and semi-automatic guns would be "very effective," while only 21% think it would be "somewhat effective" and 36% see such control as "not effective."
This contention carries into partisan lines, as 61% of Democrats view gun control as very effective, while only 26% of Republicans feel similarly. Similarly, mental health carried partisan trends, with Democrats more strongly supporting mental health screening and treatment than Republicans (67% to 35%). Republicans on the other hand tended to support decreasing depictions of violence in the media and having at least one school official carry a gun (55% and 49%, respectively), when compared with Democrats (44%, 27%).
The ensuing debate has centered on gun control and this poll reveals more contention on this issue, as compared with the top three responses. 42% believe that banning the sale of assault and semi-automatic guns would be "very effective," while only 21% think it would be "somewhat effective" and 36% see such control as "not effective."
This contention carries into partisan lines, as 61% of Democrats view gun control as very effective, while only 26% of Republicans feel similarly. Similarly, mental health carried partisan trends, with Democrats more strongly supporting mental health screening and treatment than Republicans (67% to 35%). Republicans on the other hand tended to support decreasing depictions of violence in the media and having at least one school official carry a gun (55% and 49%, respectively), when compared with Democrats (44%, 27%).
How would you solve the debt crisis?
With all of the controversy regarding the United States' debt, several sites have released games that allow people to try their own hands in debt balancing. Specifically, the Committee for a Responsible Federal Budget released the interactive tool seen in the graphic. Choose when to phase out troops from Afghanistan and Iraq, whether or not to pursue a moon colony, and how to treat retirees. The site displays savings relative to current policy dependent upon the policies you choose.
The Wall Street Journal released a similar activity, allowing you to choose between "fiscal cliff" scenarios, extending current legislation, or adopting new measures of your own. The decisions one makes influence whether or not the United States debt would make it to 60% of GDP in 2020, as some policymakers and experts have suggested.
Price for Partridges Rise, Turtledoves Constant
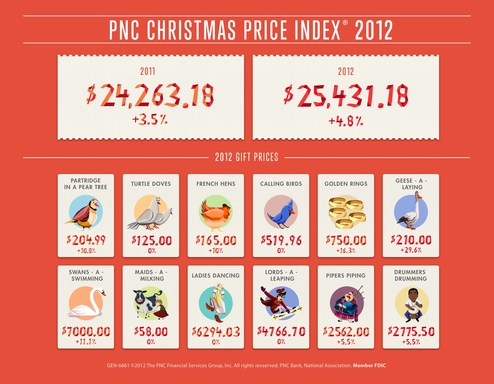
In their yearly display of price change and how it affects holiday prices, PNC has again released their Christmas Price Index. This interactive feature allows users to track the price changes of each subject of the popular Christmas carol, "The Twelve Days of Christmas," beginning with a partridge in a pear tree, with the price of the tree determined by a local Philadelphia nursery and the partridge by the Cincinnati Zoo and Botanical Gardens. Other prices can be found here.
This year the cost of Christmas is $25,431.18, up 4.8% since 2011's score of 24,263.18. This is the cost to purchase each of the 78 items in "The Twelve Days of Christmas," with the least expensive being the eight maids-a-milking, as determined by US minimum wage law, which hasn't changed since 2009. The most expensive item on the list (topping ten lords-a-leaping), are the seven swans-a-swimming at $7,000, up 11.1% from their 2011 price of $6,300.
However, indices like these should be taken with a grain of coal; criticism of PNC's index can be found here. According to the critics, Christmas' price when adjusted for inflation are not as high as perceived. Additionally, what is the price of the cow for the maids-a-milking, how long are the dancers dancing for, and where are you going to find real lords to leap (The index measures the going rate for male ballet dancers)? Ultimately, this lighthearted game of Christmasnomics isn't without its Scrooges, but it shows relative economic change; swans are up, maids unchanged.
American Perception of Job Climate at Highest Since Financial Crisis
According to a survey conducted by Gallup, 24% of Americans think of now as a good time to find a quality job. Out of context 24% may seem low, but this number reflects the highest the workplace outlook has been since the financial crisis began in March in 2008.
Perceptions differ from region to region, with people in the Midwest and South viewing their prospects more negatively, at 22% and 19% respectively, with Americans from the West (31%) and East (28%) tend to view their job climates more favorably.
These more positive perceptions occur in tangent with two indexes created by Gallup that are currently experiencing upticks, the Job Creation Index and the Economic Confidence Index, which can be seen here.
Perceptions differ from region to region, with people in the Midwest and South viewing their prospects more negatively, at 22% and 19% respectively, with Americans from the West (31%) and East (28%) tend to view their job climates more favorably.
These more positive perceptions occur in tangent with two indexes created by Gallup that are currently experiencing upticks, the Job Creation Index and the Economic Confidence Index, which can be seen here.
Marriage Still in Recession
The Pew Research Center released a new report detailing the continued decline of marriage in 2011. Using data collected by the Census Bureau's American Community Survey, Pew reported on the 4.2 million Americans who tied the knot in 2011. This continues the downward trend in marriage that began when the ACS began asking about marital status in 2008.
Half (51%) of all adults were married in 2011, as compared with 72% in 1960. This downward trend occurred among all age and education groups, with the largest drop occurring among the less-educated. Between 2008 and 2011, marriage among Americans without a high school or equivalent education fell by 14%, while those with a college degree only fell 10%.
Mixed GDP Prospects for the Eurozone
According to a recent interactive chart by The Economist, problems surrounding the euro have eased since restructuring took place. Spearheaded by the president of the European Central Bank, the ECB has, under specific conditions, purchased short-term bonds from countries that were facing economic decline. Countries that were facing severe economic decline have seen gains, notably in the area of current-account deficits turning to surpluses in Ireland. Also quite positive, Spain and Portugal's current-account deficits have been lessened.
Government debt is still a subject for concern in the peripheral countries of the Eurozone, with Portugal, Ireland, and Italy having governmental debt at over 100% of their GDP. Greece is in the deepest debt, with government debt at 175% of the Greece's GDP. Another area for future progress is within the increased gap between the countries within the Eurozone that are doing the lending and those that are on the recipient end of those loans; Germany's GDP will grow this year, while Greece's will fall, adding another year to its six of recession.