Education in the US: Separate and Unequal


In a new study of 4,400 two and four year college and university systems by the Georgetown University Center on Education and the Workforce (CEW), "Separate and Unequal: How Higher Education Reinforces the Intergenerational Reproduction of White Racial Privilege,” it was found that the higher education system acts as a means of transferring White privilege from generation to generation. Further, the authors find that the percentage of White students at the 468 most well-funded and selective college and universities is increasing relative to the number of college age students of all races, while African American and Hispanic students are increasingly attending the 3,250 least well-funded, open-access two and four year colleges.

The top 468 colleges spend between two and five times more per student than open-access two and four year colleges leading to higher graduation rates giving their graduates a competitive advantage in the marketplace over equally qualified African American and Hispanic graduates of less well-funded institutions.

Anthony Carnevale, director of the center and coauthor, said, “The higher education system is color blind, in theory, but in fact operates, at least in part, as a systematic barrier to opportunity for many African-Americans and Hispanics, many of whom are college-qualified but tracked into overcrowded and underfunded colleges where they are less likely to develop fully or to graduate.”

Read more:
http://cew.georgetown.edu/separateandunequal/
http://cew.georgetown.edu/

Latinos and the Language of the News


In a recent report, Mark Hugo Lopez and Ana Gonzalez-Barrera from the Pew Research Hispanic Center found that an increasing number of Latino adults are getting their news in English and fewer are getting news in Spanish. The results are based on the National Survey of Latinos (NSL) that was conducted from September 7 through October 4, 2012, using a nationally representative sample of 1,765 Latino adults. The interviews were conducted in English and Spanish on cell phones and landline telephones.

According to the survey, one-third (32%) of Hispanic adults said that they got their news exclusively in English in 2012, up from 22% in 2006. And 82% of Hispanic adults said they got some of their news in English in 2012, up from 78% in 2006. By contrast, the share of Hispanic adults who got their news exclusively in Spanish has decreased to 18% in 2012, down from 22% in 2006. While those who said that they got some of their news in Spanish has declined, to 68% in 2012, down from 78% in 2006. Half of Latino adults say they got their news in both languages in 2012, down from 57% in 2010.

Read more here:
 About the authors:


Growth of the Nonreligious

The new, nationwide survey by the Pew Research Center’s Forum on Religion & Public Life of 4,006 adults conducted March 21-April 8, 2013, asked Americans whether having "more people who are not religious" is a good thing, a bad thing, or doesn't matter for American society.  About half of Americans say the growing number of "people who are not religious" is bad for American society.


Fully a third of U.S. adults say they do not consider themselves a "religious person." And two-thirds of Americans say religion is losing its influence in Americans’ lives. Many more say the growing number of "people who are not religious" is bad than good (48% versus 11%). But about four-in-ten (39%) say it does not make much difference. Even among adults who do not identify with any religion, only about a quarter (24%) say the trend is good, while nearly as many say it is bad (19%); a majority (55%) of the unaffiliated say it does not make much difference for society.


Members of all the major U.S. religious groups with large enough samples for analysis are more inclined to see this development as a bad than good thing for society. White evangelical Protestants are especially likely to say the growing number of people who are not religious is a bad thing, with nearly eight-in-ten (78%) holding this view. Majorities of black Protestants (64%) and white non-Hispanic Catholics (56%) say the same. Fewer than one-in-ten in each of the three groups says this trend is a good thing for society.

The balance of opinion also is lopsided among white mainline Protestants, among whom 45% say the increase in those who are not religious is a bad thing, just 6% say it is a good thing, and 46% say it doesn't make much difference for society.


Among Hispanic Catholics, 36% say it is bad for society, 11% say it is good for society, and about half (48%) say the trend does not matter.

U.S. Hispanic Adults Twice as Likely to Identify or Lean Democratic

According to Gallup, a compilation of  daily tracking data for 2012 shows that 51% of Hispanic adults identify as or lean Democratic, with 24% of Hispanic respondents identifying as or leaning Republican.  Upon further probing of initial responses, 20% of Hispanics were true independents and did not have a party preference.

This trends holds true across age groups for the Hispanic population.  50% of the 18-34 and 35-54 age group identified or leaned Democratic, while the 59% of the 55+ age group identified similarly.  While similar across age groups, the Hispanic population is not as identified with the Democratic Party as the Non-Hispanic Black population, but more likely than the Non-Hispanic White population to identify with the Democratic Party.  In addition, an earlier Gallup analysis reveals that U.S.-born Hispanics were more likely to be Republican than their foreign-born counterparts.

First and Second Generation Immigrants

According to a recent analysis conducted by the Pew Research Center, it appears that second generation immigrants fare better than first generation immigrants on a variety of socioeconomic indicators. For one, second generation immigrants earn more than their first generation counterparts. On average, second-generation Americans earn about $12,300 more than immigrants and only $100 less than all U.S. Americans. Fewer second-generation Americans are living in poverty than first-generation immigrants (18% and 11% respectively, compared to a 13% poverty rate for all Americans). Moreover, second-generation Americans are also more likely to hold a bachelor’s degree or higher: Although only 29% of immigrants graduated from college, 36% of second-generation Americans completed college (higher than the national average of 31%). Homeownership rates are also higher among second generation Americans. Among second-generation Americans, 64% are homeowners compared to 51% of immigrants.  

The analysis also found that second generation Americans are more likely to identify themselves as a "typical American", speak English, and are more likely to report positive intergroup relations. About 52% of second-generation Latinos and 64% of Asians report that they get along very well with a variety of other groups in American, such as African Americans and whites. In contrast, only 26% of Latinos immigrants and 49% of Asians reported the same.


Strong Latino Vote for Obama


In an analysis of exit polls conducted by the Pew Hispanic Center, Barack Obama carried 71% of the Latino vote in Tuesday’s election.  While Democratic candidates have long held an advantage with the Latino electorate, Obama had the second highest advantage with 44% more Latino votes than Mitt Romney.  Bill Clinton takes top billing with the highest advantage among Latinos in 1996 (51%), while the Democratic candidate with the lowest advantage was John Kerry in 2004 (18%).

In addition, the 2012 Presidential race shows more Hispanic support for Obama than 2008, up eight points since the 2008 election.  Also of note, the Hispanic electorate is growing (Latinos made up 8% of the population in 2008, 10% in 2012), making them a salient group of voters in the battleground states of Florida, Nevada and Colorado.  In each of these states, Latino voters comprised more of the voting population than in 2008, up one point in Colorado, two points in Arizona, and three points in Florida.

Other interesting trends within the Latino population show that Hispanic women favored Obama as compared to men (76% to 65%); younger Hispanics were more inclined than older Latinos to vote for Obama (18-29 at 74%, 65+ at 65%); Hispanics will no college degree voted Democrat more than college graduates (75% to 62%); those who made less than $50,000 a favored Democrats more than those who earned above $50,000 (82% to 59%).

Rise In Immigrants Contributes to Increase in Educational Achievement


The number of college and high school graduates continues to rise. Pew Research Center reports that about 90% of 25-29 year olds graduated from high school and more than one-third of Americans between 25-29 acquired a bachelor's degree or higher. The educational attainment gap between men and women also continues to increase. Approximately 37% of women compared to 30% of men between the ages of 25-29 have completed college. This growth in college graduates is due, in part, to an increase in the number of immigrants. In the past, natives were usually more educated than their immigrant counterparts. However, over the past decade, greater numbers of recent immigrants have at least a bachelor's degree. According to Pew, the plurality of newly arrived immigrants are from Asia. This increase in immigrants from Asia contributes to the rising educational levels among immigrants, since Asians rank among the highest educated ethnic group. This is reflected in the figure on the right, which shows that 60% of Asian immigrants have a bachelor's degree, followed by 40% of Whites, 23% of Blacks, and 15% of Hispanics.

Record-High Latino Voter Registration, but Latino Voter Turnout Trends Low

The Pew Hispanic Center has recently released a report detailing the current registration of Latino voters for the upcoming presidential election, revealing an all-time high of nearly 24 million Latino voters registered to vote.  These 23.7 million registered Latino voters are up 22% since 2008; this aligns with the fact that Latino voters now comprise 11% of the nation's available voters, up from 9.5% in 2008.

Despite the high number of Latino registered voters, the registered Latinos are much less likely to show up at the polls than registered whites and blacks.  Half of the Latino voters who were registered in 2008 voted, while 65% and 66% of registered whites and blacks voted, respectively.  Additionally, 55% of Hispanics are ineligible to vote (for example, not U.S. citizens or too young to vote) while only 31% of blacks and 21% of whites are ineligible.

The disparity between eligible Latino voters and continued low turnout has caused quite a stir within the media.  In a piece analyzing this occurrence, Ed Pilkington of The Guardian states that "the statistics spell enormous potential rewards for any politician or political party who manages to release the Latino genie from the bottle."

Millions of Americans Unable to Afford Prescription Medication


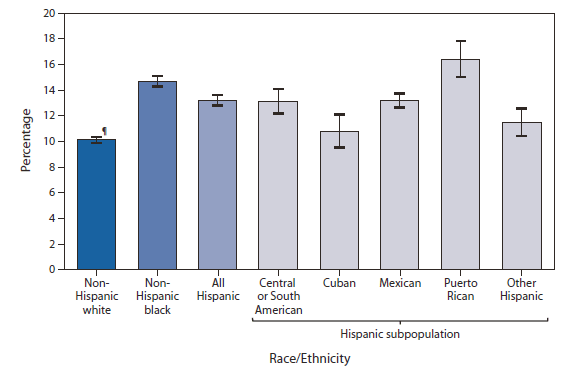
Prescription medicine is often unattainable for millions of Americans simply due to the price of these drugs.  The Centers for Disease Control and Prevention’s National Health Interview Survey illustrates the difficulties in accessing medicine that exist for a significant proportion of Americans.  In the past year, 10.1% of non-Hispanic white adults reported that drug costs prevented them from buying necessary medications.  That percentage jumps to 13.2% for Hispanics and rises further to 14.7% of non-Hispanic blacks.  Interestingly, there are significant variations between Hispanic sub-populations: while 16.4% of Puerto Rican adults could not afford prescription drugs in the past year, a comparatively low percentage of Cuban adults (10.8%) were unable to buy necessary drugs.

Almost Half of Hispanic Population Concentrated in Ten Metropolitan Areas


Coinciding with National Hispanic Heritage Month, the Pew Hispanic Center released a report detailing the characteristics of 60 of the largest metropolitan areas by Hispanic population.  Using the 2010 American Community Survey, the report found that 45% of the Hispanic population in the United States is concentrated in just 10 metropolitan areas.  The 5.7 million Hispanics in the Los Angeles-Long Beach area account for more than 1 in every 10 Hispanics in the United States, with the New York-Northeastern New Jersey population containing 8% of the nation's Hispanic Population. 

The report goes on to say that in Miami and San Antonio, Hispanics make up over half of the population, and that the same is the case in eleven more of the sixty largest metropolitan areas by Hispanic population.  Included in the report is a breakdown of population by Hispanic origin group, with the largest origin group being Mexican-Americans at 65%.  The full report, as well as an interactive map, can be found here.

Income, Poverty and Health Insurance Coverage


On Wednesday, the Census released its yearly report on "Income, Poverty, and Health Insurance Coverage in the United States: 2011."  Median household income fell for the fourth straight year to $50,054.  Men still earn more than women; the median income for men was over $11,000 more than for women.  Looking at various ethnicities, Asians possess the highest median household income at $65,129, followed by Whites with $55,412, Hispanics at $38,624, then and Blacks with $32,229. 

The recession's impacts on income were wide-ranging, and as a result poverty increased drastically.  While the poverty rate fell, it did so only slightly, dropping from 15.1% in 2010 to 15.0% in 2011.  Since 1965, the poverty rate jumped above 15.0% for just five years – 1982, 1983, 1993, 2010 and 2011. 

Lastly, health insurance coverage improved slightly from 2010; however, over 48 million continue to forego coverage.  15.7% of the population lacks health insurance.  This lackluster rate finds its roots in companies' inability to provide employer-based coverage, and in Americans’ inability to simply find a job.  With an unemployment rate that has doubled since the start of the recession and businesses around the country struggling to remain profitable while still providing health benefits, 11 million less Americans received health insurance through their jobs in 2011 than in 2000.  On the other hand, the number of people relying on government health insurance programs, such as Medicare and Medicaid, has shot upwards more than 31 million in that same timeframe.  

Obesity in America


Gallup’s assessment of obesity in America illustrates some interesting trends.  Blacks are more likely to be obese than any other race.  20.8% of Blacks received the distinction of falling into the obese class I.  8.8% were in obese class II and 6.0% in obese class III. The latter two categories are recognized as very obese.  Asians were the least likely to be obese with only 7.6% falling into obese class I, 2.1% in obese class II, and 1.0% in obese class III.  Overall, men are more likely than women to be obese, but a slightly higher percentage of women are categorized in obese class III (4.0% versus 2.9%).  Additionally, unemployed Americans are more likely to be obese than those who possess a job.  

Finally, both income and education are related to obesity levels.  As Americans obtain higher levels of education (the study tracks those with high school or less up to postgraduate degrees), they are less likely to be obese.  5.2% of those who earn less than $36,000 a year have BMIs high enough to be categorized in obese class III, compared to just 1.8% of Americans who earn greater than $90,000 a year.  

To be considered obese, one must have a body mass index (BMI) of over 30.  For a person who is 5 feet 9 inches, his/her weight would need to rise above 203 pounds to be classified as obese.  To fall under obese class III, that same person would need to weigh over 271 pounds.

Nearly 1 in 5 Americans Participate in Social Welfare Programs


The Census Bureau reports that 18.6%, or 44.8 million, of noninstitutionalized civilians participated in one or more major means-tested assistance programs (Temporary Assistance for Needy Families  (TANF), General Assistance (GA), Supplemental Nutrition Assistance Program (SNAP)/Food Stamps, Supplemental Security Income (SSI), Medicaid, and Housing Assistance).  This percentage is up from 17.1% in 2004, driven mostly by a 2.6 percent increase in citizens who receive Food Stamps.  The average monthly participation rate for those under 18 was 34.6% in 2009, far greater than the 13.7% and 12.6% for civilians aged 18 to 64 and 65 years and over respectively.  Blacks and Hispanics were the most likely races to utilize means-tested programs.  38.9% of Blacks, 33.0% of Hispanics, 14.9% of Asian and Pacific Islanders, and 11.8% of Non-Hispanic Whites participated in means-tested programs.

Census Predicts Hispanic Population Within U.S. to Grow to 132.9 Million by 2050


Roberto Ramirez, Chief of the Ancestry and Ethnicity branch of the U.S. Census Bureau, appeared on C-SPAN to discuss the current and future Hispanic population in America.  Currently, 52 million Hispanics reside in America, accounting for 16.7% of the entire U.S. population.  In the past decade, the U.S. population added 30.1 million residents, 16.7 million (55.5%) of whom were Hispanic. 

Births within the U.S. contributed to almost two thirds of the growth within the Hispanic population, with migration accounting for the other third.  Additionally, Hispanics predominantly originate from Mexico, with more than 31 million hailing from the nation.  Mr. Ramirez projects the Hispanic population within the U.S. to swell to over 132 million, 30.2% of Americans, by 2050.

White Americans Possess 22 Times More Wealth Than Black Americans


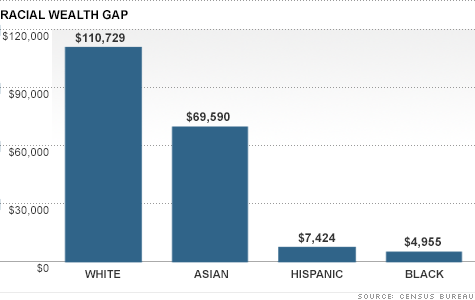
Tami Luhby, writing for CNN, highlighted the widening wealth gap between races.  In 2010, the median household net worth for whites was $110,729, whereas the median Hispanic and black household possessed a net worth of $7,424 and $4,955 respectively.  The median Asian household net worth was $69,590.  However, all three minorities were hit hard by the economic downturn, and from 2005 to 2010 the three minority groups saw their median household income decrease by about 60%.  On the other hand, the median white household experienced a drop in net worth of only 23%.  Today, white Americans possess 22 times more wealth than blacks, and that disparity has almost doubled since the recession.

More Than 1 in 4 Fathers Live Apart From Their Children


Just in time for Father’s Day, the Pew Research Center released a study on children under the age of 18 living with their parents.  Since 1960, while the percentage of children living apart from their mothers has increased only marginally (from four to eight percent) the percentage of children living separately from their fathers has risen dramatically.  In 1960, 11% of children lived apart from their fathers, but in 2010, that figure has risen to more than 1 in 4 (27%).  Black and Hispanic fathers more likely to reside separately from their children at 44% and 35% respectively.  Educational attainment also plays a key role in predicting whether the father will live separately from the child, with only 7% of fathers with a college degree living apart from their children.  In the survey, 27% of fathers who live apart from their children say they had not seen their child once in the previous year, but 41% say they exchange calls and emails several times a week.

SSDAN Director Dr. William H. Frey Points to Minorities as Key Factor in 2012 Presidential Election


On May 1st, SSDAN Director Dr. William H. Frey released a report for the Brookings Institution citing what he believes to be a key factor in the upcoming presidential election: the minority vote. The first aspect Dr. Frey highlights is the disparity between eligible voters and the total minority population.  For every 100 Hispanic residents in America, only 44 are eligible to vote, whereas for every 100 white residents, 78 are eligible to vote. 

Additionally, Dr. Frey points to the greatly increased voter turnout rate among minorities in 2008 compared to 2004.  Blacks, Hispanics, and Asians all experienced an increase in voter turnout between 2004 and 2008, but what makes this trend significant is the fact that minorities overwhelmingly vote in favor of the Democratic candidate. 

Finally, Dr. Frey emphasizes the idea that "minorities will account for a slightly larger share of eligible voters than in 2008. At the same time, white support for the Republican candidate may be greater than in 2008. Which dynamic will prevail?"  To answer this key question, Dr. Frey illustrates three different scenarios, each taking into account different assumptions of white and minority voting patterns.

In the first scenario, Dr. Frey conducts a simulation based on the 2008 turnout and margins for whites and minorities.  In this scenario, President Obama would win the election handily, garnering 358 electoral votes to Governor Romney's 180 (270 is needed to win). 

The second scenario applies the 2004 turnout and margins for whites and minorities to the simulation.  In this situation, Governor Romney wins a neck and neck election, receiving 286 electoral votes to President Obama's 252. 

Lastly, Dr. Frey generates a third scenario, which takes into account the 2004 turnouts and margins for whites, and the 2008 turnouts and margins for minorities.  In this final scenario, President Obama receives 292 electoral votes to Governor Romney's 246. 

In the full report, Dr. Frey details the historical voting patterns of minorities, and he provides a more in depth look at what to expect for the minority influence on the 2012 election.  Finally, for more information on historical voting patterns among various demographics, SSDAN recently released a brief detailing voter turnout in the past half-century. 

Blog Archive