

The S&P 500 returns imply real GDP growth 4% in Q3
We have been following the link between the S&P 500 and real GDP since 2008, when the first version of our S&P 500 quantitative modelwas published. We revisit our prediction on a regular basis and calculate a new forecast. Last time, we discussed the model on February 5, 2012 and reported a good prediction for the prior period. Here, we update our model with the revised GDP estimates and include the advance GDP estimate for the third quarter of 2012. The monthly closing prices through September 2012 are used.
As discussed in our working paper on the S&P 500 index, there exists a trade-off between the growth rate of real GDP, G(t), and the S&P 500 return, R(t). The predicted returns, Rp(t), can be obtained from the following relationship:
Rp(t) = 0.0054dlnG(t) - 0.03 (1)
where G(t) is represented by the Q/Q (annualized) growth rate, because only quarterly readings of real GDP are published by the BEA. Figure 1 compares the observed and predicted returns through September 2012. The third quarter of 2012 is characterized by a rapid rise in the level of the S&P 500 index and its returns over the previous 12 months. The real GDP estimate for the third quarter will be available in approximately two weeks, but one may estimate this value from the S&P 500 returns using (1). Three red diamonds in Figure 1 represent the predicted growth in the returns for the (annualized) GDP growth rate of 4%.
Therefore, the stock market index indicates the growth rate of real GDP above the consensus estimate for the third quarter. Our estimate is also supported by the fall in the rate of unemployment to 7.8% in September from 8.1% in August, which corresponds to the GDP growth rate above 3% per year.
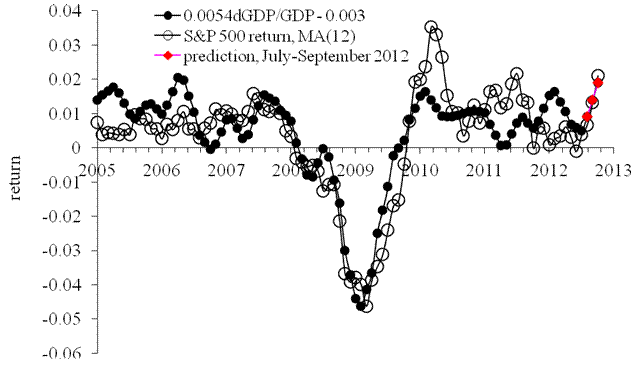
Figure 1. The predicted and observed S&P 500 return. The predicted curve is smoothed by MA(4). The 12-month S&P return observed during the third quarter of 2012 implies the real GDP growth rate of 4%.
Spain: 33% unemployed in 2013?
A year ago, we described the evolution of unemployment in Spain using the LSQ technique as applied to the integral version of Okun’s law:
u(t) = u(t0) + bln[G/G0] + a(t-t0) (1)
where u(t) is the rate of unemployment at time t, G is the level of real GDP per capita (we used TED, Conference Board, EKS PPP ), aand b are empirical coefficients. The best-fit (dynamic) model for Spain minimizing the RMS error of the cumulative model (1) is as follows:
du = -0.406dlnG + 2.00, t<1995
du = -1.11dlnG + 1.54, t>1994 (2)
This model suggests a big shift in the slope and a smaller change in the intercept around 1995. Having a new unemployment estimate for 2011, we have updated Figure 1 (original Figure 1) from our previous post and confirmed the excellent predictive power of the model. The predicted value is 21.4% and that borrowed from the U.S. BLS is 21.8%.
Figure 1 also shows a prediction (red circle) of the unemployment rate in Spain in case of a 10% fall in real GDP per capita in 2013. The current economic performance in Spain is awful and some experts see a GDP fall of 25%. We are scared to publish the number for the fall by a quarter of the current GDP level since even a 10% fall will result in a 33% rate of unemployment. Essentially a one third of labor force will be unemployed. Unfortunately, even a zero GDP growth rate will result in a 1.5% increase in unemployment (see eq. 2).

Figure 1. The observed and predicted rate of unemployment in the Spain between 1971 and 2011.
In 2013, the rate may reach 33% in case of 10% fall in real GDP.
The cumulative form of the dynamic Okun’s law is characterized by standard error of 1.68% for the period between 1971 and 2011 (0.92% after 1995). The average rate of unemployment for the same period is 13.6% (14.6% after 1995) with a standard deviation of the annual increment of 2.12%.
A Beautiful Fall Day
Thursday was a fantastically beautiful fall day, especially for flying. The wind was calm and the visibility was unlimited. I knew I had to get my plane out before the cold front moved in.
I left work early and pulled my plane out of the hangar. After a short mechanical issue with the brakes, I went flying around the whole valley, from Fielding and Thatcher to Plymouth and over to Newton and Logan. I made a stop in Logan and on the way home I took these photos of the Wellsville Mountains. The Fall colors were vivid and bright.


I left work early and pulled my plane out of the hangar. After a short mechanical issue with the brakes, I went flying around the whole valley, from Fielding and Thatcher to Plymouth and over to Newton and Logan. I made a stop in Logan and on the way home I took these photos of the Wellsville Mountains. The Fall colors were vivid and bright.


The Brigham City Temple is barely visible over the nose of my airplane.



View of the Bear River Valley looking South.


And finally home again to the Brigham City Temple!
Russia: an economic projection from IMF
International Monetary Fund has issued a new "World Economic Outlook". This is a sixty page document with lots of tables and figures. For Russia, it's not too much reported. IMF expects the Russian GDP to grow by 3.7% in 2012 and by 3.8% in 2013. This is 0.3% and 0.1% less than was predicted in July. A sad trend which may extend in the future. Economic "activity in Russia, which has benefited various economies in the region, has also lost some momentum recently."
Central Bank Total Assets increased to 50% of the 2008 GDP, which is less than in China but higher than in India and Brazil. An important value for Russia is the difference between global oil demand and supply. With the Russian 10.7 million barrels production per day the global production excess in 1.7 millions a day (supply is 90.1 and demand - 88.1). Oil price has a downward tendency.
Central Bank Total Assets increased to 50% of the 2008 GDP, which is less than in China but higher than in India and Brazil. An important value for Russia is the difference between global oil demand and supply. With the Russian 10.7 million barrels production per day the global production excess in 1.7 millions a day (supply is 90.1 and demand - 88.1). Oil price has a downward tendency.
Americans Lacking a Religious Affiliation on the Rise

The Pew Forum on Religion and Public Life reports that although the number of Americans who identify as Atheist or lack a religious affiliation has increased, many of them still believe in God. About 20% of US adults are either Atheist, Agnostic, or lack any religious affiliation. However, of the 46 million adult Americans who are unaffiliated, two-thirds report that they believe in God and one-fifth report that they pray on a daily basis.
Among those 65 and older, 90% are religiously affiliated. Among those 18-29, only 67% have a religious affiliation. Interestingly, the decline has not been uniform among all religions. Protestants have taken the largest hit. Between 1972 and 2010, there was an 11% dip in the number of adult Americans who identified as Protestant. However, those identifying as Catholic remained relatively stable during the same time period, with 26% identifying themselves as Catholic in 1972 compared to 25% in 2010. Moreover, the rise in the number of Americans who identify as religiously unaffiliated could have major implications for future elections. Americans who lack a religious affiliation tend to lean Democrat, with nearly 63% of those registered to vote reporting that they are either Democrat or lean towards the party.
Among those 65 and older, 90% are religiously affiliated. Among those 18-29, only 67% have a religious affiliation. Interestingly, the decline has not been uniform among all religions. Protestants have taken the largest hit. Between 1972 and 2010, there was an 11% dip in the number of adult Americans who identified as Protestant. However, those identifying as Catholic remained relatively stable during the same time period, with 26% identifying themselves as Catholic in 1972 compared to 25% in 2010. Moreover, the rise in the number of Americans who identify as religiously unaffiliated could have major implications for future elections. Americans who lack a religious affiliation tend to lean Democrat, with nearly 63% of those registered to vote reporting that they are either Democrat or lean towards the party.
On the limits of economic growth
The discussion of the growth limits frightens the public. The perspective to have no growth in the near future puts the lives of our children under a great danger of having no work and fun. It is really frightening. This assumption comes from the theory of economic growth based on technological progress as the driver of real GDP. Since the inception, the technology and its progress has been mainly associated with the production of goods. The portion of workforce and capital needed to produce all goods for a given society has been decreasing over time due to millions and millions scientific inventions and major breakthroughs in engineering. When this tendency is extended years ahead one may suggest that the production of goods will require just a handful of people and a fraction of capital.
The frightening thing – this tendency does exist. Figure 1 shows the evolution of a few ratios: the portions of services and goods (also split into durable and non-durable goods) in the U.S. gross domestic product. The portion of goods in the GDP has been declining since 1951, which is the start year of our graphs. The portion of durable goods is constant (around 10%) since 1951. The fall in the goods portion is chiefly related to non-durable goods. The rate of fall has been decelerating since the start of the 1980s.
The portion of services in the GDP has been growing along a linear trend since the beginning and is about 47% in 2012. There is some room for the further growth in the 21st century. The portion of goods may decline to 25% of the GDP. Currently, the deceleration in the fall of the nondurable goods portion is explained by the increasing share of the PCE in the GDP, as Figure 2 demonstrates. This increase is compensated by a falling portion of the government consumption expenditures and gross investment.
Extrapolating all trends in the future, one may assume that there is no danger to the growth in real GDP which is defined the growing portion of services, which include not only technological progress per se but also human resources. As long as Humans have personal creativeness to please other Humans real economic growth is not in danger.


Figure 2. The portion of PCE in GDP


