“Behind a cancer-treatment firm’s rosy survival claims”


In a recent post on the blog, Statistical Modeling, Causal Inference, and Social Science, the following was reported:

Brett Keller points to a recent news article by Sharon Begley and Robin Respaut:
A lot of doctors, hospitals and other healthcare providers in the United States decline to treat people who can’t pay, or have inadequate insurance, among other reasons. What sets CTCA [Cancer Treatment Centers of America] apart is that rejecting certain patients and, even more, culling some of its patients from its survival data lets the company tout in ads and post on its website patient outcomes that look dramatically better than they would if the company treated all comers. These are the rosy survival numbers . . .
Details:
CTCA reports on its website that the percentage of its patients who are alive after six months, a year, 18 months and longer regularly tops national figures. For instance, 60 percent of its non-small-cell lung cancer patients are alive at six months, CTCA says, compared to 38 percent nationally. And 64 percent of its prostate cancer patients are alive at three years, versus 38 percent nationally.
Such claims are misleading, according to nine experts in cancer and medical statistics whom Reuters asked to review CTCA’s survival numbers and its statistical methodology.
The experts were unanimous that CTCA’s patients are different from the patients the company compares them to, in a way that skews their survival data. It has relatively few elderly patients, even though cancer is a disease of the aged. It has almost none who are uninsured or covered by Medicaid – patients who tend to die sooner if they develop cancer and who are comparatively numerous in national statistics. . . . Accepting only selected patients and calculating survival outcomes from only some of them “is a huge bias and gives an enormous advantage to CTCA,” said biostatistician Donald Berry . . .
What I really like about this article is how it combines quantitative information with qualitative interviews:
Carolyn Holmes, a former CTCA oncology information specialist in Tulsa, Oklahoma, said she and others routinely tried to turn away people who “were the wrong demographic” because they were less likely to have an insurance policy that CTCA preferred. Holmes said she would try to “let those people down easy.” . . .
The ads also challenge viewers to “compare our treatment results to national averages.” Doing so, on the company’s website, shows that CTCA’s reported survival outcomes regularly beat those averages.
Experts in medical data who reviewed CTCA’s claims for Reuters say those claims are suspect because of what they called deviations from best practices in statistics – in particular, comparing its carefully selected patients to those nationwide.
“It makes their data look better than it is,” said Robert Strawderman, professor and chairman of biostatistics at the University of Rochester. “So the comparisons used to suggest that CTCA has better survival rates are pretty meaningless.”

Demographics and Leanings of Nonvoters

By choosing not to vote, nonvoters will influence the upcoming election, but with a great deal of media attention on just who is voting, Pew Research Center releases a survey describing those who choose not to come to the polls.

Back in 2008, nonvoters made up 43% of the population of those who could vote.  The current nonvoting population, which strongly favors Obama at 59%, strongly differs from the likely voting population which is split at 47% for both candidates.

Independents make up the largest proportion of nonvoters with 44%, whereas only 27% of likely voters have described themselves as independent.  More Democrats than Republicans are nonvoters, 29% and 17% respectively, while they are locked in a near tie among the likely voting population, 35% and 34% respectively.

In addition, Pew released another table describing gender, religion, and income here.  Key notes show that those with higher incomes are more likely to be voters than nonvoters, that men are more likely than women to be considered as nonvoters, younger voters are more likely nonvoters, and that the category of nonvoters is more likely to be Hispanic.


Population Density in the Early 20th Century


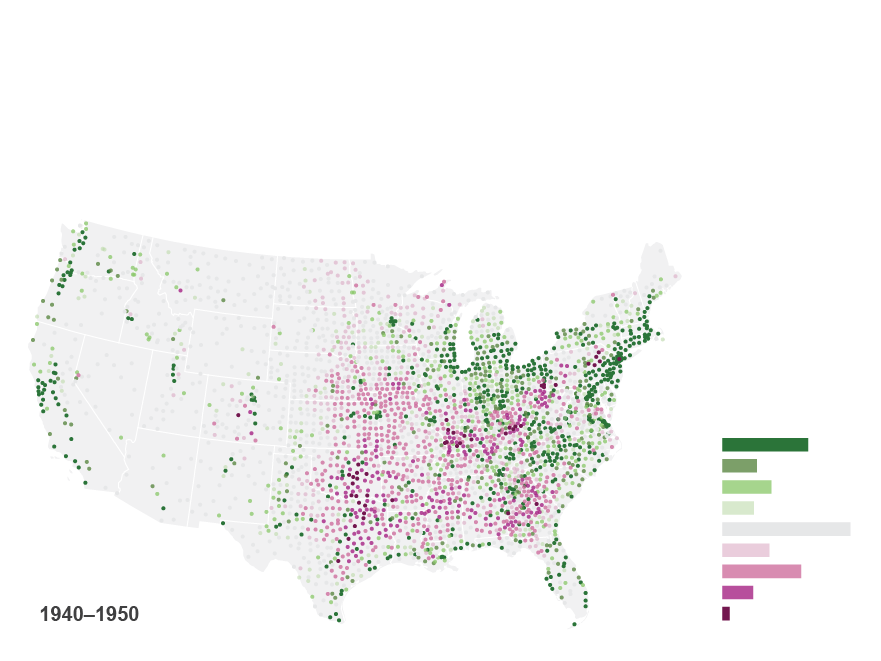
The Census Bureau's weekly data visualization shows the change in population density by county of the United States each decade from 1920-1950.  In the 1920s, predominantly rural counties in the East saw declining population densities due to a trend of migration to cities.  The 1930s saw the Great Plains decline in population while rural areas in the East became more densely populated again.  As World War II ended, the United States saw increased geographic mobility, which led to 21.5 percent of civilians moving to different counties or states between 1940 and 1947.  The map shows that urban and populated Northeast and Midwest counties saw the largest growth in the 1940s, while predominantly rural counties in the Great Plains and the South continued to see declining population density.

Increasing Diversity in Largest Metros

SSDAN and Brookings Institution demographer Bill Frey analyzed data from Census 2010 and found that minorities comprise the majority in 32 of the 50 largest metro areas in America. Many cities, especially in the South and Southwest, are plurality black or plurality Hispanic, while others remain plurality but not majority non-Hispanic white. Cities in the great plains tend to remain majority white.

Within cities, minorities are increasingly following whites into the suburbs with 35% of suburban residents now minorities. Heavily concentrated in metro areas, Hispanics make up 26% of city dwellers, 17% of suburbanites and 16% of the population overall. Blacks make up 22% of city dwellers, 10% of suburbanites and 12% of the population overall. The Census Bureau itself predicts that the nation as a whole will be majority-minority by 2042 due to heavy immigration from Central America and higher birthrates among Hispanics than among non-Hispanic whites.

This graphic from the Wall Street Journal shows the plurality ethnic groups in the 100 largest metro areas in the United States. ZM cf

Population Explosion

Contrary to previous predictions that expected the world's population to stabilize around 9 billion around mid-century, a new report from the United Nations predicts continued growth through 2100. The world's population is expected to reach over 10.1 billion before stabilizing. The majority of population growth is expected to occur in Africa, the world's least developed region. Along with Asia, Africa will also be home to most of the world's people: of the 10.1 billion people expected 90 years from now, 8.17 are expected to live in Africa or Asia. This estimate has been revised upward because fertility rates have declined more slowly than expected in poorer countries and inched upwards in some wealthier ones such as the United States and United Kingdom. Even in the developing world, people live longer than ever before; the worldwide life expectancy is just shy of 70, and infant, child and maternal mortality are lower than ever. All of this is surely good, but birth rates in Africa especially have not come downward sufficiently to offset these trends.

So what does this mean? Can the world support 10 billion? Or will shortages of food and water or threats like climate change put a catastrophic brake on population growth? If there have been two constants over the last several hundred years, they have been a population explosion and unprecedented increases in living standards. A panel at the New York Times discusses what the future holds for a more populous planet and how we can continue to increase living standards in a more populous world. Joel Cohen points out that increased access to contraception and women's empowerment could slow population growth and that even if the UN report is correct, food shortages are unlikely to occur. According to Cohen, the world already produces plenty of food for 10 billion people, but distributes it unevenly. James Cascio, on the other hand, notes that while subsistence is possible, we will need new technology to allow 10 billion to aspire to the meat and energy intensive lifestyle of the West. Warren Sanderson and David Bloom underscore Cohen's call for efforts to control population, while Jason Clay worries that food production and distribution must be made far more efficient.


ZM cf

TV's, Fridges, and the Mexican Census

An article from the Economist demonstrates a few interesting demographic trends suggested by the Mexican census, whose data was released to journalists just last week.

Two decades ago 20% of Mexican households had a bare earth floor. Today that figure is now 5%. In that same time period the proportion without electricity shrank from 10% to almost zero, and those that went without sewage decreased to 10% from almost a third.

It is also interesting to note that more houses have televisions than refrigerators, and that more houses have refrigerators than showers. Also, more individuals have a cell phone than a landline phone.


Mexico's literacy rate today is over 98%. But these national figures can be misleading because there are still numerous inequalities across regions. For example, the percentage who cannot read or write in Mexico City is 2%. But go south to Chiapas, a state in the south, and that figure climbs to 20%. Also, while the population of Mexico City fell by about 6% over five years, that for Baja California Sur rose by 10%.

Blog Archive