Unemployment Rate Differences between Black and White Americans


A recent Pew Research Center report in FacTank, analyst, Drew DeSilver, said that since 1954, the unemployment rate of Black Americans has consistently been twice that of White Americans. The report is based on data taken from the Labor Force Statistics, a part of the Current Population Survey (CPS), a monthly survey of 4,500 scientifically selected American households. The data are collected for the U. S. Bureau of Labor Statistics by the U.S. Census Bureau. 

 In 1954, the unemployment rate for Black Americans was 1.98 times that of White Americans while in 2013 the rate for Black Americans was exactly twice that of White Americans and in 1983, the rate for Black Americans was 2.32 times that of White Americans. Overall, the unemployment rate for Black Americans since 1954 is 2.2 times that of White Americans.


Read more:
http://pewrsr.ch/13FF0U0  
http://www.pewresearch.org/
http://www.pewresearch.org/fact-tank/
http://www.pewresearch.org/author/ddesilver/
http://www.bls.gov/cps/
http://www.bls.gov/
http://www.census.gov/

Approval Rates of Black and White Marriage


A recent article from Gallup based on their Minority Rights and Relations poll, conducted June 13-July 5 which surveyed 4,373 Americans, including 1,010 non-Hispanic Blacks reports one of the largest shifts of public opinion in Gallup history, 87% of Americans now favor marriage between Blacks and Whites, up from 4% in 1958. The report explained its findings:
Approval of marriages between Blacks and Whites is up one percentage point from 2011, when this attitude was last measured. Approval has generally increased in a linear fashion from Gallup's first measure in 1958, reaching the majority threshold in 1997, and crossing the three-quarters line in 2004. Eleven percent of Americans today say they disapprove of Black-White marriage, compared with 94% who disapproved in 1958.

Blacks' approval of Black-White marriage (96%) is now nearly universal, while Whites' approval is 12 percentage points lower, at 84%. Blacks' approval has consistently been higher than Whites' over the decades, although attitudes among both racial groups have generally moved in a parallel manner since 1968, when Gallup was first able to report reliable estimates of each group's opinion. The gap between Black approval and White approval in recent years has been smaller than it was prior to 1997.


Read the full article here:  http://www.gallup.com/poll/163697/approve-marriage-blacks-whites.aspx

Education in the US: Separate and Unequal


In a new study of 4,400 two and four year college and university systems by the Georgetown University Center on Education and the Workforce (CEW), "Separate and Unequal: How Higher Education Reinforces the Intergenerational Reproduction of White Racial Privilege,” it was found that the higher education system acts as a means of transferring White privilege from generation to generation. Further, the authors find that the percentage of White students at the 468 most well-funded and selective college and universities is increasing relative to the number of college age students of all races, while African American and Hispanic students are increasingly attending the 3,250 least well-funded, open-access two and four year colleges.

The top 468 colleges spend between two and five times more per student than open-access two and four year colleges leading to higher graduation rates giving their graduates a competitive advantage in the marketplace over equally qualified African American and Hispanic graduates of less well-funded institutions.

Anthony Carnevale, director of the center and coauthor, said, “The higher education system is color blind, in theory, but in fact operates, at least in part, as a systematic barrier to opportunity for many African-Americans and Hispanics, many of whom are college-qualified but tracked into overcrowded and underfunded colleges where they are less likely to develop fully or to graduate.”

Read more:
http://cew.georgetown.edu/separateandunequal/
http://cew.georgetown.edu/

Americans Regard Military Highly


The Pew Forum on Religion and Public Life reports that the American public’s esteem for the Military is high. The findings are based on a survey of 4,006 adults via telephone interviews conducted March 21-April 8, 2013. The report further explains the findings:

Americans report that they continue to hold the military in high regard, with more than three-quarters of U.S. adults (78%) saying that members of the armed services contribute “a lot” to society’s well-being. That’s a modest decline from 84% four years ago, the last time the Pew Research Center asked the public to rate various professions. But the military still tops the list of 10 occupational groups, followed closely by teachers, medical doctors, scientists and engineers. A solid majority of the public says each of those occupations contributes a lot to society.


Whites are somewhat more likely than either Blacks or Hispanics to say members of the military contribute a lot to society. And Republicans and independents who lean toward the Republican Party are somewhat more likely than Democrats and independents who lean toward the Democratic Party to see the military as contributing a lot to society.

The full article can be read here:  http://www.pewforum.org/Other-Demographics/Public-Esteem-for-Military-Still-High.aspx

Overestimating the Black Population in the US


A recent article in The Atlantic reported that the 2000 General Social Survey asked 1,000 White adults to estimate what percentage of the US population is Black. 95% of White women and 85% of White men overestimated that percentage, which at the time, was 12%.  The overestimation was stronger for women than men: 69% of women and 49% of men guessed that Blacks comprised more than 20% of the population. 

Growth of the Nonreligious

The new, nationwide survey by the Pew Research Center’s Forum on Religion & Public Life of 4,006 adults conducted March 21-April 8, 2013, asked Americans whether having "more people who are not religious" is a good thing, a bad thing, or doesn't matter for American society.  About half of Americans say the growing number of "people who are not religious" is bad for American society.


Fully a third of U.S. adults say they do not consider themselves a "religious person." And two-thirds of Americans say religion is losing its influence in Americans’ lives. Many more say the growing number of "people who are not religious" is bad than good (48% versus 11%). But about four-in-ten (39%) say it does not make much difference. Even among adults who do not identify with any religion, only about a quarter (24%) say the trend is good, while nearly as many say it is bad (19%); a majority (55%) of the unaffiliated say it does not make much difference for society.


Members of all the major U.S. religious groups with large enough samples for analysis are more inclined to see this development as a bad than good thing for society. White evangelical Protestants are especially likely to say the growing number of people who are not religious is a bad thing, with nearly eight-in-ten (78%) holding this view. Majorities of black Protestants (64%) and white non-Hispanic Catholics (56%) say the same. Fewer than one-in-ten in each of the three groups says this trend is a good thing for society.

The balance of opinion also is lopsided among white mainline Protestants, among whom 45% say the increase in those who are not religious is a bad thing, just 6% say it is a good thing, and 46% say it doesn't make much difference for society.


Among Hispanic Catholics, 36% say it is bad for society, 11% say it is good for society, and about half (48%) say the trend does not matter.

Millions of Americans Unable to Afford Prescription Medication


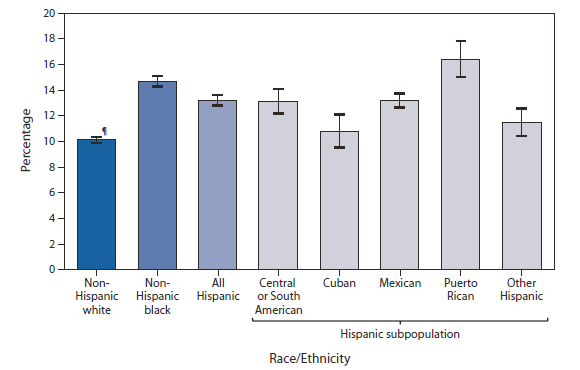
Prescription medicine is often unattainable for millions of Americans simply due to the price of these drugs.  The Centers for Disease Control and Prevention’s National Health Interview Survey illustrates the difficulties in accessing medicine that exist for a significant proportion of Americans.  In the past year, 10.1% of non-Hispanic white adults reported that drug costs prevented them from buying necessary medications.  That percentage jumps to 13.2% for Hispanics and rises further to 14.7% of non-Hispanic blacks.  Interestingly, there are significant variations between Hispanic sub-populations: while 16.4% of Puerto Rican adults could not afford prescription drugs in the past year, a comparatively low percentage of Cuban adults (10.8%) were unable to buy necessary drugs.

Income, Poverty and Health Insurance Coverage


On Wednesday, the Census released its yearly report on "Income, Poverty, and Health Insurance Coverage in the United States: 2011."  Median household income fell for the fourth straight year to $50,054.  Men still earn more than women; the median income for men was over $11,000 more than for women.  Looking at various ethnicities, Asians possess the highest median household income at $65,129, followed by Whites with $55,412, Hispanics at $38,624, then and Blacks with $32,229. 

The recession's impacts on income were wide-ranging, and as a result poverty increased drastically.  While the poverty rate fell, it did so only slightly, dropping from 15.1% in 2010 to 15.0% in 2011.  Since 1965, the poverty rate jumped above 15.0% for just five years – 1982, 1983, 1993, 2010 and 2011. 

Lastly, health insurance coverage improved slightly from 2010; however, over 48 million continue to forego coverage.  15.7% of the population lacks health insurance.  This lackluster rate finds its roots in companies' inability to provide employer-based coverage, and in Americans’ inability to simply find a job.  With an unemployment rate that has doubled since the start of the recession and businesses around the country struggling to remain profitable while still providing health benefits, 11 million less Americans received health insurance through their jobs in 2011 than in 2000.  On the other hand, the number of people relying on government health insurance programs, such as Medicare and Medicaid, has shot upwards more than 31 million in that same timeframe.  

Obesity in America


Gallup’s assessment of obesity in America illustrates some interesting trends.  Blacks are more likely to be obese than any other race.  20.8% of Blacks received the distinction of falling into the obese class I.  8.8% were in obese class II and 6.0% in obese class III. The latter two categories are recognized as very obese.  Asians were the least likely to be obese with only 7.6% falling into obese class I, 2.1% in obese class II, and 1.0% in obese class III.  Overall, men are more likely than women to be obese, but a slightly higher percentage of women are categorized in obese class III (4.0% versus 2.9%).  Additionally, unemployed Americans are more likely to be obese than those who possess a job.  

Finally, both income and education are related to obesity levels.  As Americans obtain higher levels of education (the study tracks those with high school or less up to postgraduate degrees), they are less likely to be obese.  5.2% of those who earn less than $36,000 a year have BMIs high enough to be categorized in obese class III, compared to just 1.8% of Americans who earn greater than $90,000 a year.  

To be considered obese, one must have a body mass index (BMI) of over 30.  For a person who is 5 feet 9 inches, his/her weight would need to rise above 203 pounds to be classified as obese.  To fall under obese class III, that same person would need to weigh over 271 pounds.

Nearly 1 in 5 Americans Participate in Social Welfare Programs


The Census Bureau reports that 18.6%, or 44.8 million, of noninstitutionalized civilians participated in one or more major means-tested assistance programs (Temporary Assistance for Needy Families  (TANF), General Assistance (GA), Supplemental Nutrition Assistance Program (SNAP)/Food Stamps, Supplemental Security Income (SSI), Medicaid, and Housing Assistance).  This percentage is up from 17.1% in 2004, driven mostly by a 2.6 percent increase in citizens who receive Food Stamps.  The average monthly participation rate for those under 18 was 34.6% in 2009, far greater than the 13.7% and 12.6% for civilians aged 18 to 64 and 65 years and over respectively.  Blacks and Hispanics were the most likely races to utilize means-tested programs.  38.9% of Blacks, 33.0% of Hispanics, 14.9% of Asian and Pacific Islanders, and 11.8% of Non-Hispanic Whites participated in means-tested programs.

White Americans Possess 22 Times More Wealth Than Black Americans


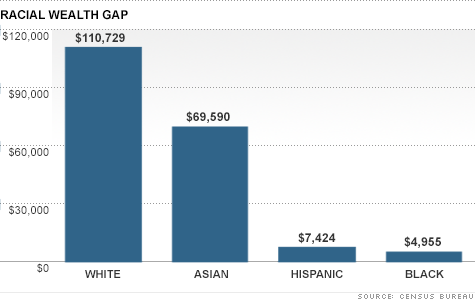
Tami Luhby, writing for CNN, highlighted the widening wealth gap between races.  In 2010, the median household net worth for whites was $110,729, whereas the median Hispanic and black household possessed a net worth of $7,424 and $4,955 respectively.  The median Asian household net worth was $69,590.  However, all three minorities were hit hard by the economic downturn, and from 2005 to 2010 the three minority groups saw their median household income decrease by about 60%.  On the other hand, the median white household experienced a drop in net worth of only 23%.  Today, white Americans possess 22 times more wealth than blacks, and that disparity has almost doubled since the recession.

More Than 1 in 4 Fathers Live Apart From Their Children


Just in time for Father’s Day, the Pew Research Center released a study on children under the age of 18 living with their parents.  Since 1960, while the percentage of children living apart from their mothers has increased only marginally (from four to eight percent) the percentage of children living separately from their fathers has risen dramatically.  In 1960, 11% of children lived apart from their fathers, but in 2010, that figure has risen to more than 1 in 4 (27%).  Black and Hispanic fathers more likely to reside separately from their children at 44% and 35% respectively.  Educational attainment also plays a key role in predicting whether the father will live separately from the child, with only 7% of fathers with a college degree living apart from their children.  In the survey, 27% of fathers who live apart from their children say they had not seen their child once in the previous year, but 41% say they exchange calls and emails several times a week.

Homeless Veteran Population Declines


From the Homelessness Research Institute's
The State of Homelessness in America 2012
The Population Reference Bureau reports that the number of homeless veterans is in decline.  From 2009 to 2011, the number of homeless veterans dropped from 75,600 to 67,500 (11% drop), but the total homeless population only fell 1 percent from 643,000 to 636,000.  38 percent of homeless people lack shelters, and instead sleep on the streets, in abandoned properties, or in cars.  Additionally, while 21 in every 10,000 in the general population are homeless, 31 of every 10,000 veterans are homeless. Of sheltered homeless veterans, 92% are male and 8% female.  52.1% are white and 35.1% are black.  The vast majority are aged 31 to 61, and roughly one in two is disabled. 

Minorities Now Account for The Majority of Births in the U.S.


This past Thursday, the Census Bureau announced that white births now account for less than half of all births in the United States.  For the first time, minorities account for the majority of births (50.4%).  Dr. William H. Frey, SSDAN Director and senior demographer at the Brookings Institution, explained, “This is an important tipping point.”  He described the trend as a “transformation from a mostly white baby boomer culture to the more globalized multiethnic country that we are becoming.  Sabrina Tavernise of The New York Times writes that Hispanics, blacks, and Asians accounted for 26%, 15%, and 4% respectively of births in the year ending in July 2011.  Still, though, whites represent 49.6% of all births – the single largest share of any ethnicity.  Dr. Frey also discovered another interesting fact: minorities accounted for a whopping 92 percent of all population growth in the decade ending in 2010.  You can read the full New York Times article here, which goes more into detail on historical implications and on what else may have contributed to this fascinating trend.

Inmate Population Declines For Third Straight Year


The Bureau of Justice Statistics released a report on the prison inmate population for midyear 2011.  By June 2011, there were 735,601 inmates in county and city jails.  The inmate population has declined for three straight years, and the incarceration rate is now at 236 per 100,000 U.S. residents, the lowest since 2002. Whites accounted for 45% of the population, followed by blacks with 38%, and Hispanics with 15% of the population.  The report also noted that jails with populations over 1,000 accounted for more than half of the decline.  Lastly, though population continues to decline, the rated capacity – the number of beds or inmates allotted to each facility – has dropped every year since 2000.  The percentage of the rated capacity filled was 84%, the lowest since 1984.

Percentage of African Americans in MLB Drops to Lowest Level Since 1940s


April 15th marked Jackie Robinson Day in Major League Baseball.  Players across the nation wore number 42 – Robinson’s number – to celebrate the first man to break the color barrier back in 1947.  However, while the integration of baseball opened the floodgates to black players, in recent years, the percentage of blacks playing America’s pastime has declined. In 1995, 19% of players were black, but today, just 8.1% of major leaguers are black, a level not seen since the late 40s and early 50s.  Business Insider highlighted this trend in its chart of the day, and also noted that while black participation in baseball has steadily decreased, the percentage of Hispanics in MLB has doubled in the past 20 years.  

More Blacks Leaving East Coast, Midwest Cities for South

A recent New York Times article focused on a black family's return to Atlanta from New York, where they had migrated in the 1950s as part of the so-called Great Migration. According to census data, from which the Times took its information, "the economic downturn has propelled a striking demographic shift: black New Yorkers, including many who are young and college educated, are heading south." And it's not just New York: "The percentage of blacks leaving big cities in the East and in the Midwest and heading to the South is now at the highest levels in decades, demographers say."

Still, the move south appears to be strongest among New Yorkers. "About 17 percent of the African-Americans who moved to the South from other states in the past decade came from New York, far more than from any other state, according to census data. Of the 44,474 who left New York State in 2009, more than half, or 22,508, went to the South." Those migrating south are typically from middle-class enclaves, and some fear their departure is having a negative impact on the communities they leave behind, "helping to depress already falling housing prices. [Their departure] is also depriving the black community of investment and leadership from some of its most educated professionals, black leaders say."

The move south is seemingly a reverse of the aforementioned Great Migration, "which lasted roughly from World War I to the 1970s and saw African-Americans moving to the industrializing North to escape prejudice and find work." But with economic opportunities in the north scarce, and the desire of many blacks to reconnect with their past in the south, the north appears to have lost its appeal for many black Americans.

NH cf

Blog Archive