An Uneven Recovery, 2009-2011

A new report released by the Pew Research Center shows that the wealthy benefited the most from the recovery in 2009 to 2011. The wealthiest 7% saw their net-worth’s rise by 28% on average. This means that their estimated wealth rose from $2.48 million in 2009 to about $3.17 million in 2011. Unfortunately, the bottom 93% of the nation did not share in this prosperity. This group actually saw their net worth fall by about 4% from $139,896 in 2009 to $133,817 in 2011. As Pew Research Center explains, this difference between the bottom 93% and the top 7% can partly be explained by taking into account the role of stocks and bonds, which thrived during the recovery and the fact that wealthier Americans tend to invest more in both stocks and bonds. In contrast, the housing market remained in a poor condition during most of the recovery and for the bottom 93%, their home comprises the bulk share of their net worth. Not surprisingly, wealth inequality also rose during the recovery.

Pew also notes that the recent Census Bureau data indicates that the bottom 93% were also less likely to own stocks and mutual funds in 2011 than in 2009. In 2009, 16% of the less affluent directly owned stocks or mutual funds but by 2011 this figure dropped to 13%. Also, a small share of the less affluent had individual retirement accounts in 2011 than in 2009 but the number of affluent people with a 401(k) remained steady at 39% for both 2009 and 2011. A smaller share of the top 7% also owned stocks or mutual funds in 2011 than in 2009 but more owned IRA’s and had more in their 401(k) in 2011 than in 2009.

Overall, net worth per household in the U.S. in 2011 made up nearly all the ground it had lost since 2005—$338,950 versus $340,252 in 2005, the latest pre-recession data published by the Census Bureau. 

White Americans Possess 22 Times More Wealth Than Black Americans


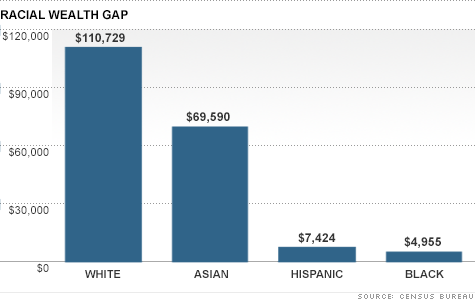
Tami Luhby, writing for CNN, highlighted the widening wealth gap between races.  In 2010, the median household net worth for whites was $110,729, whereas the median Hispanic and black household possessed a net worth of $7,424 and $4,955 respectively.  The median Asian household net worth was $69,590.  However, all three minorities were hit hard by the economic downturn, and from 2005 to 2010 the three minority groups saw their median household income decrease by about 60%.  On the other hand, the median white household experienced a drop in net worth of only 23%.  Today, white Americans possess 22 times more wealth than blacks, and that disparity has almost doubled since the recession.

Numbers in Poverty Up; Minorities Hardest Hit As Wealth Disparity Widens

According to a recent report from the Census Bureau, 2.6 million more Americans fell into poverty in 2010; the 46.2 million people in poverty signaled both "the fourth consecutive annual increase and the largest number in the 52 years for which poverty estimates have been published." The report also contained disturbing news regarding the middle class: the New York Times writes that "median household incomes fell last year to levels last seen in 1997."

Lawrence Katz, an economics professor at Harvard, dubbed the period "a lost decade." He told the Times that this "was the first time since the Great Depression that median household income, adjusted for inflation, had not risen over such a long period," and he went so far as to say that "the median family is in worse shape than it was in the late 1990s." Adjusted for inflation, the median household income dropped to $49,445, a decline of 2.3 percent and seven percent below the high of $53,252 in 1999.

15.1 percent of Americans were below the poverty line ($22,314 for a family of four) last year, the highest percentage since 1993. And as the Times points out, the gap between the wealthy and poor continued to grow: "Median household income for the bottom tenth of the income spectrum fell by 12 percent from a peak in 1999, while the top 90th percentile dropped by just 1.5 percent."

The rising poverty rate was most severe for blacks and Hispanics. 27 percent of blacks were in poverty in 2010, up from 25 percent in 2009, and 26 percent of Hispanics--up from 25 percent in 2009--were also below the line. 9.9 percent of whites were in poverty in 2010, as compared with 9.4 percent in 2009. Among Asians, however, the poverty rate remained steady at 12.1 percent.

According to the Times, most economists agree that "joblessness was the main culprit pushing more Americans into poverty." And with President Obama recently proposed jobs bill, analysts say the Census report could swing support either way. As the Times reports, "the bleak numbers could help [Obama] make his case for urgency...[b]ut they could also be used against him by Republican opponents seeking to highlight economic shortcomings on his watch."

NH cf

Blog Archive