I've found a new projection of labor force in Japan between 2010 and 2050. It says that the rate of labor force participation will be decreasing together with the depopulation of Japan. This means that the level of labor force will be falling much faster than it was used in my recent prediction. Considering the multiplication factor of 1.4, the rate of CPI inflation will reach -1% per year on average in 2020. By 2050, it will reach almost 2% per year (1.89%). The overall drop in consumer prices will be more than 2/3 by 2050. This fall will be accompanied by the decrease in real GDP at a rate of 1% per year and the debt rise to 500% of GDP.

Exploring Japan: on dismal perspectives of consumer prices
In this post, we continue to validate our predictions of the rate of consumer price inflation (CPI) in Japan by the estimate for 2011. The Japan Bureau of Statistics has estimated the rate of CPI inflation as -0.3%. Now we have an estimate of labour force for 2011 and are able to compare the observed and predicted figures.
We have been following inflation in Japan since 2005 when our first paper on the Japanese economy was published and covered the period through 2003. We have revisited inflation in Japan in 2010 and confirmed the predictions of deflation as expressed by the negative GDP deflator. In this blog, we also reported on deflation (both CPI and GDP deflator) several times.
The case of Japan is the best illustration of our concept linking inflation to the change in labour force. (In a sense, all developed countries stay on the brink of deflation because of the threat of falling labour force.) Therefore we do not suggest the liquidity trap in Japan or any mistakes in monetary policy (inflation does not depend on monetary policy as our model shows.). The evolution of inflation is completely driven by the change in labour force. This is an unfortunate situation for Japan since the level of labour force can only fall in the long run due to the decreasing working age population.
Previously, we carried out an estimation of empirical relationship between the change rate of labour force, dlnLF(t)/dt, and inflation, p(t).
First, we test the existence of a link between inflation and labour force. Because of the structural (likely related to definition and measurement procedure) break in the 1980s, we have chosen the period after 1982 for linear regression. By varying the lag between the labour force and inflation one can obtain the best-fit coefficients for the prediction of CPI inflation, p(t), according to the following relationship (updated with new data since 2009):
p(t) = 1.39dlnLF(t-t0)/dt + 0.0004 (1)
where the time lag t0=0 years; standard errors for both coefficients are shown in brackets. Figure 1 (upper panel) depicts this best-fit case. (The period after 2003 is highlighted.) There is no time lag between the inflation series and the labour force change series in Japan. Free term in (1), defining the level of price inflation in the absence of labour force change, is statistically undistinguishable from zero.
A more precise and reliable method to compare observed and predicted inflation consists in the comparison of cumulative curves. Short-term oscillations and uncorrelated noise in data as induced by inaccurate measurements and the inevitable bias in all definitions should be smoothed out in cumulative curves. Any actual deviation between two cumulative curves persists in time if measured values are not matched by the defining relationship.
The predicted cumulative values shown in the lower panel of Figure 1 are very sensitive to the free term in (1). For Japan, the cumulative curves are characterized by complex shapes. There are periods of intensive inflation and a deflationary period. The labour force change, defining the predicted inflation curve, follows all the turns in the measured cumulative inflation.
One can conclude that relationship (1) is valid and the labour force change is the driving force of inflation. Statistically, the evolution of the overall level of consumer prices in Japan is fully defined by the change in labour force. Hence, no other variable or process can affect the change in price. Otherwise, the statistically reliable link would not exist.
Having the projection of labour force borrowed from the National Institute of Population and Social Security Research, one can predict the future of CPI inflation in Japan. It will be decreasing to the level of -1% per year in 2050.
Conclusion: invite immigrants and start a baby boom today! Otherwise, the level of consumer prices in 2050 will be a half of that of today.


Figure 1. Measured inflation (CPI) and that predicted from the change rate of labour force. Upper panel: Annual curves. Lower panel: Cumulative curves between 1982 and 2011. A good agreement between the cumulative curves illustrates the predictive power of our model.

Figure 2. Scatter plot: predicted vs. measured rate of CPI inflation.

Figure 3. Projection of the labour force evolution between 2005 and 2050.

Figure 4. The rate of CPI inflation in Japan through 2050.
Asian Americans and Identity
 Data from the Pew Research Center demonstrate how different Asian American groups identify themselves. Overall, 62% of all Asian Americans usually describe themselves by articulating their country of origin. 19% refer to themselves as Asians or Asian Americans, and 14% identify simply as Americans.
Between Asian groups, however, there is some variation in the ways individuals identify. About three quarters of both the Vietnamese and Korean populations identify with their country of origin. Indian, Chinese, and Japanese Americans exhibit the smallest percentage of individuals who identify with their country of origin (six in ten).
Another way to look at the data is by distinguishing the foreign born population of Asian Americans from the native born population of Asian Americans. Among the foreign born, seven in ten identify with their country of origin, while only four in ten in the native born population will do the same. Conversely, a mere 9% of foreign born Asians describe themselves as American, but 28% of the native born call themselves as American.
South Korea to Surpass Japan's GDP per Person

Although Japan was once the foremost nation in terms of economic growth, the Economist's daily chart suggests that this trend is changing. Countries like South Korea, Singapore, and Taiwan, who used to trail behind Japan in regards to GDP per person, are now quickly outpacing Japan. Even more remarkable, South Korea is expected to achieve a higher GDP per person measured at purchasing-power than Japan within five years. Singapore outpaced Japan in this category in 1993 and Taiwan passed Japan in 2010. However, the case of South Korea will be extraordinary, give that 32 years ago South Korea’s GDP per person was roughly a fourth of Japan’s.
World's Nuclear Power Producers

 The Economist’s Graphic Detail blog post earlier this week highlighted their nuclear energy interactive guide, which shows the nuclear electricity production, number of operational reactors, and the metric tons of uranium required for nuclear production of 30 countries currently using nuclear power. According to the map, the US produces by far the largest amount of nuclear power at about 800 terawatt hours (TWh), with France following at a little over 400 TWh and Japan at 280 TWh. (It is important to note that this data was produced before the Fukushima Daiichi nuclear disaster in March 2011, which has led to a shutdown of almost all of Japan's nuclear reactors.)
However, the map showing nuclear electricity as a percentage of total production shows the U.S. produces a relatively small proportion of their electricity through nuclear power (just under 20%). France’s nuclear power makes up the largest percentage of their total electricity at 74.1%, followed by Slovakia at 51.8% and Belgium at 51.2%.
GDP Growth Predictions Indicate Sluggish Recovery, but Possible Return to Form In 2013 For Some Economies

Tim Duy on Japan or why macroeconomics is wrong
Tim Duy on Economists View posted (http://economistsview.typepad.com/economistsview/2012/01/fed-watch-japan-revisited.html) on the current recovery of Japan and also mentioned usuall macroeconomic rubbish on "lost decades". This is one of good examples showing that the mainstream macroeconomic theories are worthless and confusing. These people do not actually understand what drive a developed economy like the Japanese one.
We have already decribed the evolution of a developed economy as expressed by real GDP per capita, G. There are two component in play - inertial growth, A/G, and the change in a specific age population, dNs/Ns ( following paragraph is borrowd from our book "mechanomics. Economics as Classical Mechanics)
dG(t)/G(t)=A/G(t)+0.5dNs(t)/Ns(t)dt (1.8)
where A is an empirically determined coefficient, Ns(t) is the number of people of the defining age. For Japan
where C is the constant of integration, i.e. the initial condition of the initial value problem.
From (1.9) one can derive either the evolution of G or Ns depending on the purpose. Since the number of 18-year-olds can be estimated by integrating (actually by summation of discrete estimates) the left hand side of (1.9) with the measured annual values of G and also enumerated by population surveys one can compare results visually and statisticaly. Figure 1.23 (also from the book) demonstartes that the evolution of G follows up the evolution of Ns. Since G can not affect Ns the causality directio is opposite - the change in Ns drives G. From 1.23, one can understand that so called "lost decades" actually manifest the fall in the number of 18-year-olds since 1992. Accordingly, the years before 1991 are charaterized by increasing Ns and thus are called "economic miracle". Finally, one can extrapolate the younger age cohorts into the future and estimate the future evolution of G. Figure 1.23 shows that the years of low economic growth are left behind and the 2010s will be charaterized inertial growth only, A/G, since Ns will not be changing. This is not fast economic growth, A/G~ 1.5% per year, but is definitely better than the permanent depression of the 1990s and 2000s.

Figure 1.23. Enumerated and predicted number of 18-year-olds.
Krugman on the effect of quantitative easing in Japan
Paul Krugman shows in this post that the original quantitative easing (QE) in Japan did not help at all. Money supply did not react to an artificial increase in the monetary base. This observation raises a question on the effectiveness of a similar monetary policy in the U.S.
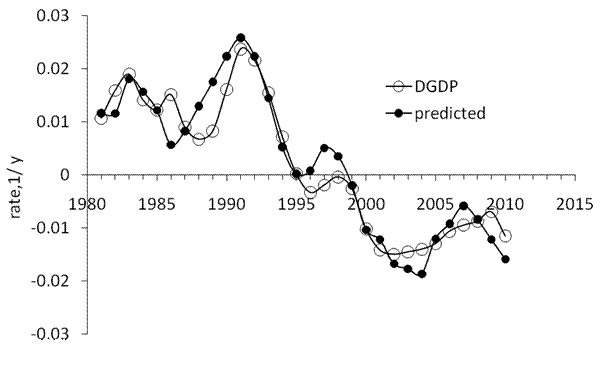
We have a simple explanation of the observed insensitivity of price inflation on QE: inflation depends on the change in labor force, LF, not on monetary policy. The following models for the GDP deflator, DGDP, and CPI inflation, CPI, were obtained and presented in our previous posts:
DGDP(t) = 1.9d(lnLF(t))/dt – 0.0084
CPI(t) = 1.3d(lnLF(t))/dt + 0.0004
Two figures below illustarte these models. There is no room for the BOJ to influence deflation after 1995.