
Richy Rich: Income Inequality Infographics
Over the past year we have heard the media frequently use the term "99%." It's a figure that Occupy Wall Street has been quick to employ to find common ground with the masses. It's also a phrase that pundits have used to comment on the platforms of this year's presidential candidates. But The Atlantic features a new way of looking at the 99% / 1% divide, by depicting incomes along a stacked bar chart that resembles the world's tallest building, the Burj Khalifa in Dubai.
The interesting chart comes from Scott Winship and is published on the Brookings Institution's website in an article about inequality within the top 1%. The differences are striking. If we take the poorest person in the top 1% of US incomes and put him on the 160th floor, then we would find the poorest person in the top 10% living on the 35th floor. Or, to put it another way, the disparity in earnings for these two individuals can be represented as a difference in 125 stories. On the other hand, consider the median household income. The poorest person in the top 50% of earners is separated from the poorest person in the top 10% by a mere 22 floors. The top one hundredth of incomes is separated from the poorest of the top 1% by 150 floors. By contrast, the difference between the poorest individuals in the top 1% and those in the 2% is 67 floors

Data in Review: The Price of Movie Tickets
Why do all movie tickets cost the same? Movie tickets don't fluctuate in price according to supply and demand. Blockbuster sellouts and movie flops all sell for the same price. To explain this occurence, an article from The Atlantic briefly explains the history of movie prices, demonstrating that during the first half of the twentieth century, movie tickets used to cost different amounts depending on their actors and popularity. Since this time, the system gradually shifted so that ticket prices from the 1970s onwards have been generally uniform across movies.
 The line graph depicts how theater attendance fluctuates through the year. Christmas is shown as the high point of the year in terms of ticket sales, while the time periods directly following Easter and Labor Day see relatively low ticket sales.
The chart does have a few shortcomings, however. The article fails to tell us the data's source. We do not know whether the graph is plotting the data from a single theater, or from an aggregate of theaters of over the course of a year. We also don't know when the data were collected. The article doesn't communicate what year or years the data come from, and there is no caption or title to further explain these details. It is also unclear what the unit of measurement is. Does 12% average weekly attendance convey the proportion of seats that are filled in a theater? Does 4% attendance during a given week represent how much that this specific week accounts for in the year's attendance?
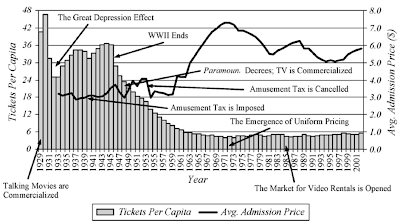
Though displaying several trends on one set of axes, the second graph is significantly clearer. The graph shows tickets per capita and the average price of a ticket from 1929 through 2001. Unlike the first graph, the axes are well labeled and they clarify the unit of measure. Although the bar chart and trend graph are superimposed on each other, they utilize the better part of the chart area. Unfortunately, the chart does not include the source of the data or a title, both of which would further clarify the the meaning of the information being represented. It would also be useful to articulate whether admissions prices are adjusted for inflation, a factor that is necessary to take into account when looking at such a large time span.

The chart does have a few shortcomings, however. The article fails to tell us the data's source. We do not know whether the graph is plotting the data from a single theater, or from an aggregate of theaters of over the course of a year. We also don't know when the data were collected. The article doesn't communicate what year or years the data come from, and there is no caption or title to further explain these details. It is also unclear what the unit of measurement is. Does 12% average weekly attendance convey the proportion of seats that are filled in a theater? Does 4% attendance during a given week represent how much that this specific week accounts for in the year's attendance?

Though displaying several trends on one set of axes, the second graph is significantly clearer. The graph shows tickets per capita and the average price of a ticket from 1929 through 2001. Unlike the first graph, the axes are well labeled and they clarify the unit of measure. Although the bar chart and trend graph are superimposed on each other, they utilize the better part of the chart area. Unfortunately, the chart does not include the source of the data or a title, both of which would further clarify the the meaning of the information being represented. It would also be useful to articulate whether admissions prices are adjusted for inflation, a factor that is necessary to take into account when looking at such a large time span.


