Business Subsidies throughout the US

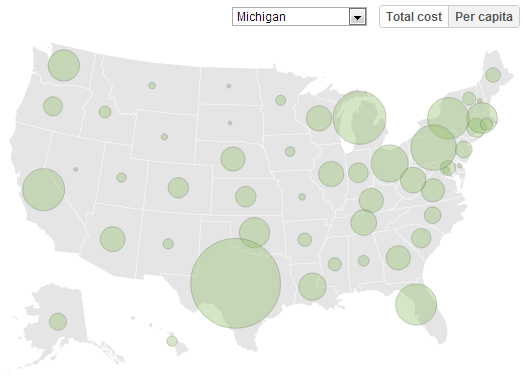
The New York Times compiled a database of incentives granted by cities, counties, and states to businesses.  Across the country, various levels of government granted $80.4 billion across 1,874 programs created to promote business.  The state with the highest percentage of business incentives per dollar in the state budget was Texas, with $0.51 for every dollar going to business incentives.  The states with the largest spending per capita were Alaska, West Virginia, and Nebraska (with $991, $845, $763 per capita respectively -- Texas ranked close with $759 per capita).

In addition, this resource lists the programs that each states employ and the companies that receive the most from these programs (to begin by looking at Texas, click here).  The New York Times also compiled a list of the 48 companies that gained more than $100 million since 2007 due to these programs; companies that topped the list of 48 were GM, Shell, and Ford, although some 5,000 more companies received more than $1 million in grants in the same time frame.

Birth Rates Reach All-Time Low among Teens


The Centers for Disease Control and Prevention announced that birth rates for U.S. teens have reached all-time lows across age and ethnic groups. The birth rate fell 9% from 2009 to 2010 among women aged 15 to 19 and the rate dropped 44% from 1991 to 2010. The number of babies born to women aged 15 to 19 was 367,752, the lowest since 1946. From 2007 to 2010, only three states – Montana, North Dakota, and West Virginia – did not experience a decrease in teen birth rates. Birth rates among minorities have dropped off sharply since 1991, but disparities remain, with non-Hispanic black, Hispanic, and American Indian or Alaska Native teens continuing to possess higher birth rates than the national average. This stands in stark contrast, however, to Asian or Pacific Islander teens, whose birth rate was only 10.9 births per 1000 women.

Hawaii Ranks First In Well-Being Index


Gallup recently released the 2011 Gallup-Healthways Well-Being Index scores for each of the fifty states.  Gallup gathered the data through surveys conducted daily from January to December of 2011.  The data are based on six sub-indices spanning from work environment to physical condition to emotional health.  Altogether, these sub-indices comprise the Well-Being Index, which is calculated on a 0 to 100 scale.  In 2011, the nation’s Well-Being Index was 66.2, down from 66.8 in 2010 and the lowest score since the study began in 2008.  The five states with the highest scores were Hawaii, North Dakota, Minnesota, Utah, and Alaska, in that order, while Ohio, Delaware, Mississippi, Kentucky, and West Virginia marked the five states with the lowest well-being scores.  Nine of the top ten states were located in the West or the Midwest, while Southern states accounted for five of the ten states with the lowest scores.  Alaskans were the most likely to rate their lives as “thriving,” giving the state the highest score in the Life Evaluation Index in the nation.  Massachusetts led the way in the Basic Access sub-index with a score of 86.6, indicating that the state’s residents have the greatest access to items essential to wellbeing, like food, medicine, shelter, a secure environment in which to exercise, and satisfaction with one’s community.  On the other end of this metric was Mississippi, scoring 77.6 and ranking last in Basic Access for the second straight year.  Hawaii’s residents performed the best in the Healthy Behaviors sub-index with a score of 68.9, meaning that Hawaiians have good eating and exercise habits, while also maintaining low smoking rates.  

Blog Archive