Oil price in 2012-2013


This is a revision to our oil price prediction as based on the difference between the overall PPI and the index of crude oil. Figure 1 compares our previous prediction in May 2011 with actual oil price in 2011 and 2012. In August 2011, the predicted price was a bit higher than the measured one. We expected the price to fall by approximately $5 per month to the level of ~$70 by December 2011. In reality, the price reflected from the high bound of the expected price (dashed line) and grew during the end of 2011. This effect reflects the high level of price volatility during short time intervals. Since February 2012, the price has been returning to the expected price range which expresses the slow fall through 2016, with the uncertainty bounds for the long-term trend in oil price shown in Figure 1. The level of oil price in 2016 is expected between $30 and $60 per barrel.
Here we confirm the oil price trend and its bounds. Red squares show our prediction of oil price through February 2013. Despite local fluctuations, the trend is negative and will bring the price to $45 (±$15) per barrel in 2016.  
Figure 1. The evolution of oil price since 2001 as estimated from the differnce of the overall PPI and the PPI of crude petroleum.

Halliburton's shares

We have already presented updated pricing models for ConocoPhillips and ExxonMobil as based on the differences between CPI and PPI components. Our share pricing concept was introduced two years ago and predicted share prices for a few energy companies. ConocoPhillips (COP) and Exxon Mobil (XOM) from the S&P 500 list were the biggest and demonstrated almost no difference in the sensitivity to the difference between the core and headline CPIs. Halliburton’s share (HAL) was also modeled showed a dramatically different sensitivity. We made a tentative conclusion that COP and XOM might have a larger return to an investor considering energy stocks.
Basically, we demonstrated that the time history of a share price, p(t), (for example, HAL) could be accurately approximated by a linear function of the difference between the core CPI, cCPI(t), and the headline CPI in the United States. At the initial stage of our research, this difference was found to be the best to predict share prices in the energy subcategory.
Mathematically, a share price, HAL(t), (we use a monthly closing price adjusted for dividends and splits) can be approximated by a linear function of the lagged difference between the core and headline CPI:
HAL(t) = A + BdCPI(t+t1)                                       (1)
where dCPI(t+t1)=cCPI(t+t1)–CPI(t+t1), A and B are empirical constants. In the original model for HAL for the period between 1999 and 2009, A=43, B=-3.5; t is the elapsed time; and t1=0 year is the time delay between the share and the CPI change, i.e. the CPI has a lag behind the share price.
In this article, we test several pricing models for Halliburton, HAL(t), with the same CPI and PPI components tested for ConocoPhillips and ExxonMobil. The set of defining indices includes: the core and headline CPI, the consumer price index of energy, eCPI, and the producer price index of crude petroleum, pPPI, together with the overall PPI. Thus, we test model (1) for HAL(t) using two different differences for the period between 2001 and 2011: 
HAL(t) = A1 + B1(cCPI(t) - eCPI(t))  (2)   
HAL(t) = A2 + B2(pPPI(t) - PPI(t))         (3) 
All coefficients in (1)-(3) were estimates by the least squares for the period between January 2001 and July 2011. As for ConocoPhillips and ExxonMobil, we found no time delay between the share price and defining differences, i.e. t1=0. 
Figures 1 through 3 compare three HAL models. Corresponding coefficients are given in Figure captions. As in our original study, the best model (in sense of RMS residual, s) for the period between 2001 and July 2011 is based on the core and headline CPI (s=$4.18). Almost the same accuracy is associated with the model based on the core and energy CPI (s=$4.44).
At the same time, model (3) based on the producer price indices is the worst (s=$9.31). This may mean that Halliburton does not depend much on the producer price indices. Interestingly, the change in oil price does accurately describe the period of the financial crisis. However, the model fails to predict slow changes in the share price. Currently, the deviation between the observed and predicted prices is $20.

Halliburton’s shares were less sensitive to the change in consumer prices during the financial crisis than those of XOM and COP. However, the overall agreement between the observed and predicted prices is very good for the past ten years. One can expect that the current deviation from the predicted price will disappear in the near future and the observed price will fall down to $40 per share. In the long-run, the expected fall in oil price at a five-year horizon down to $30 per barrel will likely result in a proportional decrease in HAL’s shares.
Figure 1.  The observed HAL price and that predicted from the core and headline CPI.  A=$43, B=-3.4.
Figure 2.  The observed HAL price and that predicted from the core CPI and the consumer price index of energy.  A1=$30, B1=-0.3.
Figure 3.  The observed HAL price and that predicted from the overall PPI and the producer price index of crude petroleum (domestic production).  A2=$25, B2=-0.13. 

Share prices: ExxonMobil vs ConocoPhillips

In a previous post we have extended our original pricing model for ConocoPhillips and found that the evolution of its share can be best approximated by a linear function of the difference between the core CPI, coreCPI, and the consumer price index of energy, eCPI.  Originally, the model for a share price, p(t), (we use a monthly closing price adjusted for dividends and splits) was based on the difference between the core and headline CPI:

p(t) = A + B (coreCPI - CPI(t))                                 (1)
where A and B are empirical constants; t is the elapsed time.  
Here we test pricing models for ExxonMobil, XOM(t), with the same CPI and PPI components as we used for ConocoPhillips. The set of defining indices includes the core and headline CPI, the consumer price index of energy, eCPI, and the producer price index of crude petroleum, pPPI, together with the overall PPI. Thus, we test model (1) with p(t)=XOM(t) and two different models for the period between 2001 and 2011: 
XOM(t) = A1 + B1(coreCPI - eCPI(t))  (2) 
XOM(t) = A2 + B2(pPPI - PPI(t))         (3) 
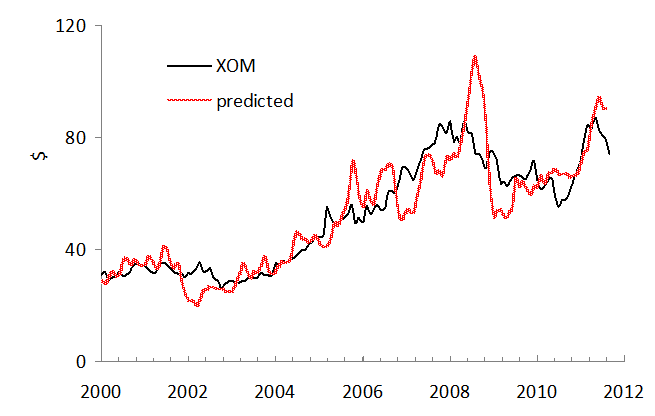
Figures 1 through 3 compare three XOM models. Coefficients in (1) through (3) are given in corresponding Figure captions. The best model (in sense of RMS residual, s) for the period between 2001 and July 2011 is based on the core and headline CPI (s=$9.32). Almost the same accuracy is associated with the model based on the core and energy CPI (s=$9.84). At the same time, model (3) based on the producer price indices is the worst (s=$10.9).
There is a dramatic difference between ExxonMobil and ConocoPhillips. The former company was less sensitive to the change in consumer prices during the financial crisis. The predicted amplitude is much higher than that observed between 2008 and 2009. ConocoPhillips has followed up the change in the difference between the core and energy CPI. When the behavior between 2008 and 2009 is extrapolated into the 2010s, the expected fall in oil price at a five-year horizon down to $30 per barrel will likely not result in a proportional decrease of XOM’s shares.
Figure 1.  The observed XOM price and that predicted from the core and headline CPI.  A=$86, B=-5.8.
Figure 2.  The observed XOM price and that predicted from the core CPI and the consumer price index of energy.  A1=$56, B1=-0.27.
Figure 3.  The observed XOM price and that predicted from the overall PPI and the producer price index of crude petroleum (domestic production).  A2=$68, B2=-0.55. 

ConocoPhillips share price to fall

Our original pricing model states that a share price, for example, that of ConocoPhillips, COP(t), can be approximated by a linear function of the difference between the core CPI, coreCPI, and headline CPI:
COP(t) = A + B (coreCPI - CPI(t))                          (1)
where A and B are empirical constants; t is the elapsed time.  Here we extend the set of defining indices by the consumer price index of energy, eCPI, and the producer price index of crude petroleum, pPPI, together with the overall PPI. Thus, we test the following models for the period between 2001 and 2011:

COP(t) = A1 + B1(coreCPI - eCPI(t))  (2)   
COP(t) = A2 + B2(pPPI - PPI(t))         (3) 

Figures 1 through 3 compare the original and new predictions for COP. Coefficients in (1) through (3) are given in Figure captions. The best model for the period between 2001 and July 2011 is based on the index of energy and core CPI. Practically the same accuracy is associated with the original model as based on the core and headline CPI. At the same time, model (3) based on the producer price indices is the worst and has failed to predict the amplitude of the largest oscillation in 2008.  

We have predicted oil price to fall through 2016. In 2011, we expect oil price to fall down to $70 per barrel. Considering these short- and mid-term predictions one can conclude that ConocoPhillips share price will be falling as well. 

Figure 1.  The observed COP price and that predicted from the core and headline CPI.  A=75, B=-5.5.

Figure 2.  The observed COP price and that predicted from the core CPI and the consumer price index of energy.  A1=58, B1=-0.54.
Figure 3.  The observed COP price and that predicted from the overall PPI and the producer price index of crude petroleum (domestic production).  A2=45, B2=-0.3.

Shimmy in economic gear. How far is the U.S. economy from a runaway?

Shimmy is a well-known mechanical effect in aircraft landing gear. During landing and take-off, the nose wheel oscillates about the vertical axis, sometimes with increasing amplitude. In the case of severe resonance oscillation, shimmy may result in the wheel  destruction.  Instructively, shimmy usually occurs in a specific band of aircraft velocities.  (A much safer but typical case of shimmy is observed in a shopping trolley.) The shimmy effect is well known and relatively well understood and modelled, although not completely.  

As an economic analogue of shimmy, we propose to take a look at the current oscillations in commodity prices.  Is it actually an economic shimmy? In several figures below we present the evolution of relative prices, pi, of selected commodities, iPPI. In order to remove the base effect we calculate the deviation from the overall PPI, PPI, and normalize it to the PPI:
pi(t)= (PPI-iPPI)/PPI
where i corresponds to iron&steel, gold ores, crude petroleum (domestic production),  copper ores, aluminium base scrap and grain. Four from these six basic commodities demonstrate a clear start of shimmy around 2005.  Aluminium base scrap and grain had higher oscillations in the past, but can be also characterized by an elevated volatility during the past 5 years.

Overall, a higher volatility is not a surprise for the market but since 2005 is has a coherent driving force behind all commodities. It is likely that there is a positive feed back in the loop of commodity pricing with money flooding into the commodity market without any restriction. For a nose wheel, similar mechanical feedback leads to shimmy and aircraft accidents. For the U.S. economy, one can expect a price runaway (gold is a candidate) if the positive feedback observed since 2005 is further retained. How far is the current situation from an accident?


Does crude drive the price index of steel and iron? (update)

We have been following the link between price indices of iron&steel and crude oil (domestic production) since 2009. This is a quarterly update. The previous update included PPI data as of November 2010. Here we extend the set by data available after April 13, 2011. Otherwise, we retain the form of the report untouched.

Historically, we first reported that the price index of crude oil had been likely evolving in sync with that of iron and steel, but with a lag of two months in September 2009  [1].  In order to present both indices in a comparable form, the difference between a given index, iPPI (i.e. iron&steel and crude), and the overall PPI was normalized to the PPI: (iPPI(t)-PPI(t))/PPI(t). The normalized differences represent the evolution of the rate of deviation from the PPI over years.  
Figure 1 depicts the corresponding time histories of the normalized deviations from the PPI, including the most recent period since December 2010.  Simple visual inspection reveals the following feature: the (normalized deviation from the PPI of the) index of iron and steel lags by approximately two months behind the (normalized) index of crude oil.
Figure 1. The deviation of the iron and steel price index and the index of crude oil from the PPI, normalized to the PPI.
In order to reduce both deviations to the same scale we additionally normalized the curves in Figure 1 to their peak values between 2005 and 2011
(iPPI(t)-PPI(t))/[PPI(t)*max{iPPI-PPI)}]
This scaling allows a direct comparison of corresponding shapes. In Figure 2, we display the normalized index of iron and steel shifted by two months ahead to synchronize its peak with that observed in the normalized index for crude petroleum. The scaled index of crude demonstrates just short-term deviations from the index of iron and steel in the overall shape and timing of the peak and trough. Simple smoothing with MA(3) makes the curves resemblance even better. As an invaluable benefit of the resemblance, one can use the two-month lag to predict the future of the iron and steel price index.
Figure 2. Deviation of the iron and steel price index from the PPI, normalized to the PPI and the peak value after 2005 as compared to the deviations of the index for crude petroleum normalized in the same way. The normalized index for iron and steel is shifted two months ahead.
Conclusion
Between 2006 and 2011, the deviation of the price index of iron and steel from the PPI in the USA repeats the trajectory of the deviation of the index of crude petroleum (domestic production) with a two-month lag. Therefore, the prediction of iron and steel price for at this horizon is a straightforward one.  
References
1. Kitov, I., Kitov, O., (2009). Sustainable trends in producer price indices, Journal of Applied Research in Finance, Spiru Haret University, Faculty of Financial Management and Accounting Craiova, vol. I(1(1)_ Summ), pp. 43-51

Blog Archive